 |
 |
 |
| Main | Introduction | Methods | Results & Discussions | Data Repository |
|---|
Results & Discussion:
| Temperature | Salinity | Density | Dissolved Oxygen | Secchi | D.O. Comparisons | Chlorophyll | Phytoplankton | Zooplankton | Sediments & TOC | Nutrients |
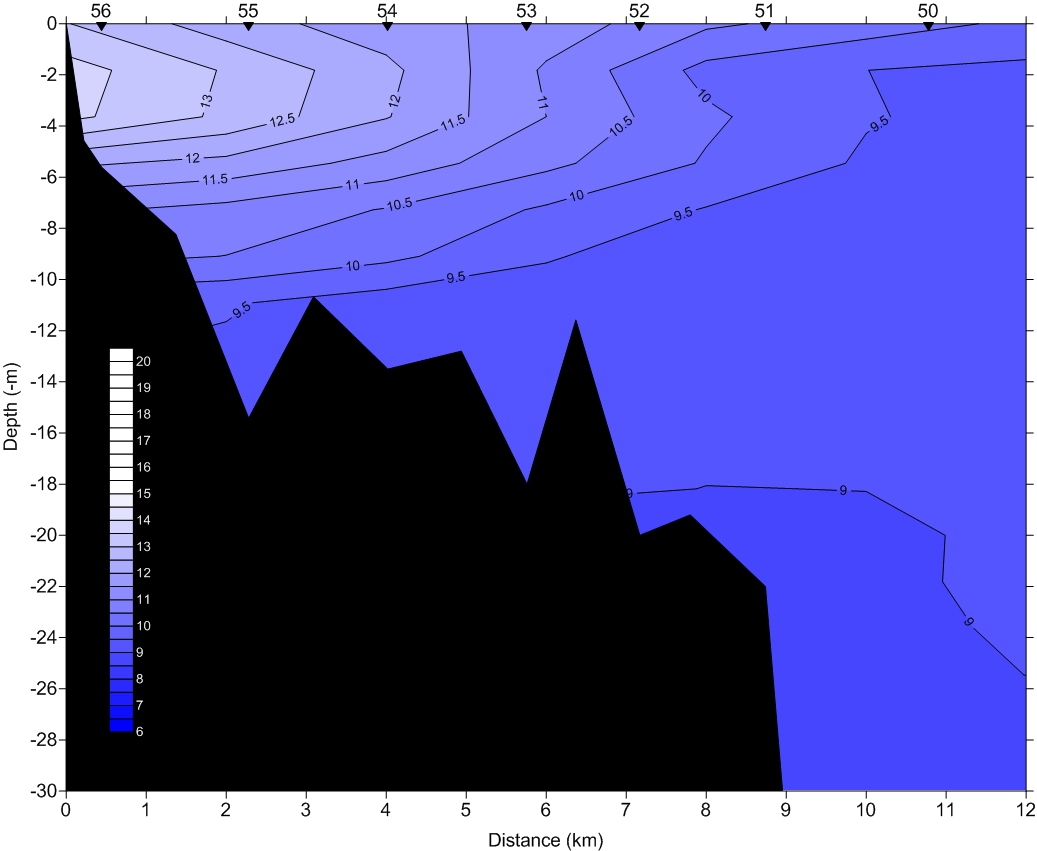
Temperatures ranged
widely at the two inner (55 and 56) and,
to a lesser degree, the three middle harbor stations (53, 54 and
Dockton). Each
station showed a very noticeable
thermocline between approximately 8 and 12 meters.
This is likely due to a relatively slow
flushing rate of the water in Quartermaster Harbor (DNR 2004). Closure of an opening
between Maury and
Vashon Island restricted the exchange of water solely to southern
harbor mouth. Conversely,
the outer harbor stations (50, 51
and 52) were well mixed throughout the water column, showing only a
slight
thermocline between approximately 5 and 10 meters.
Overall, stratification increased with
distance from the entrance into Quartermaster Harbor.
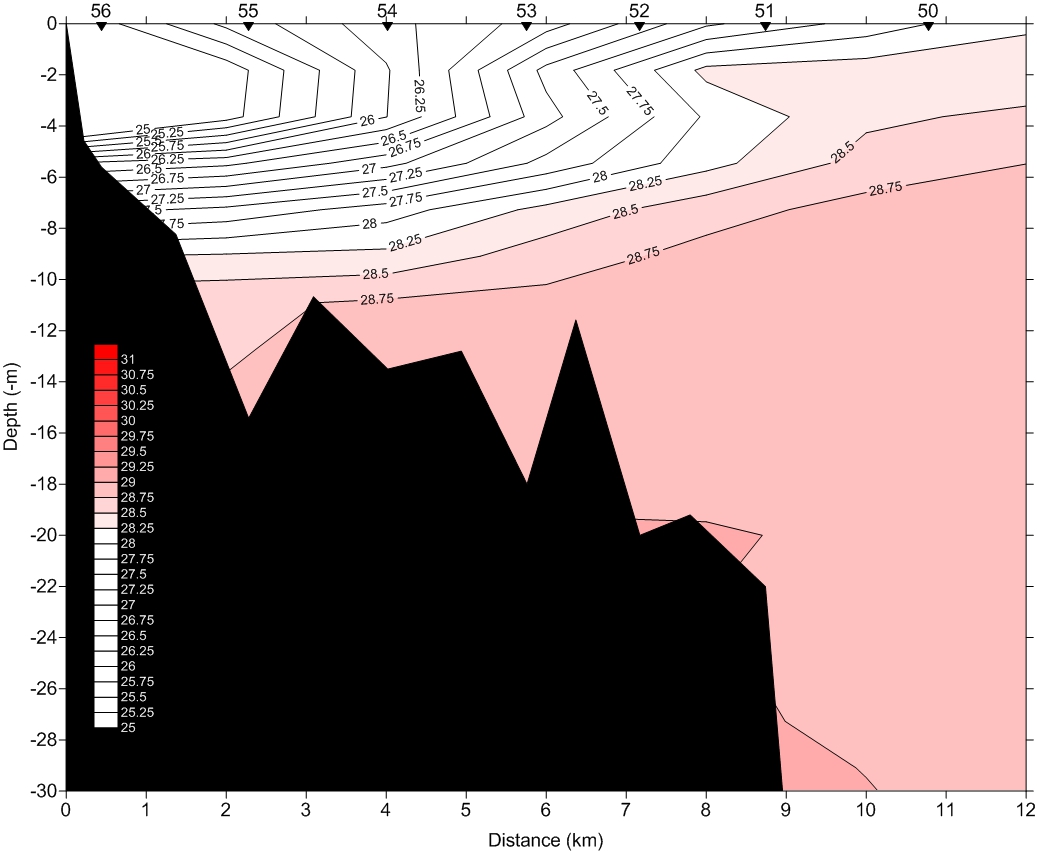
All inner and middle
harbor stations showed a very
noticeable halocline between approximately 5 and 7 meters in depth. During the week prior to
sampling, 3.0 in of
precipitation was recorded at the nearby Tacoma Narrows Airport. This likely increased the
input of the many small
fresh water streams that empty into Quartermaster Harbor. Being less dense, this
water then overlays
the denser, saltier water entering from Puget Sound.
Outer harbor stations showed a much higher
degree of mixing with a much less noticeable halocline at approximately
5
meters.
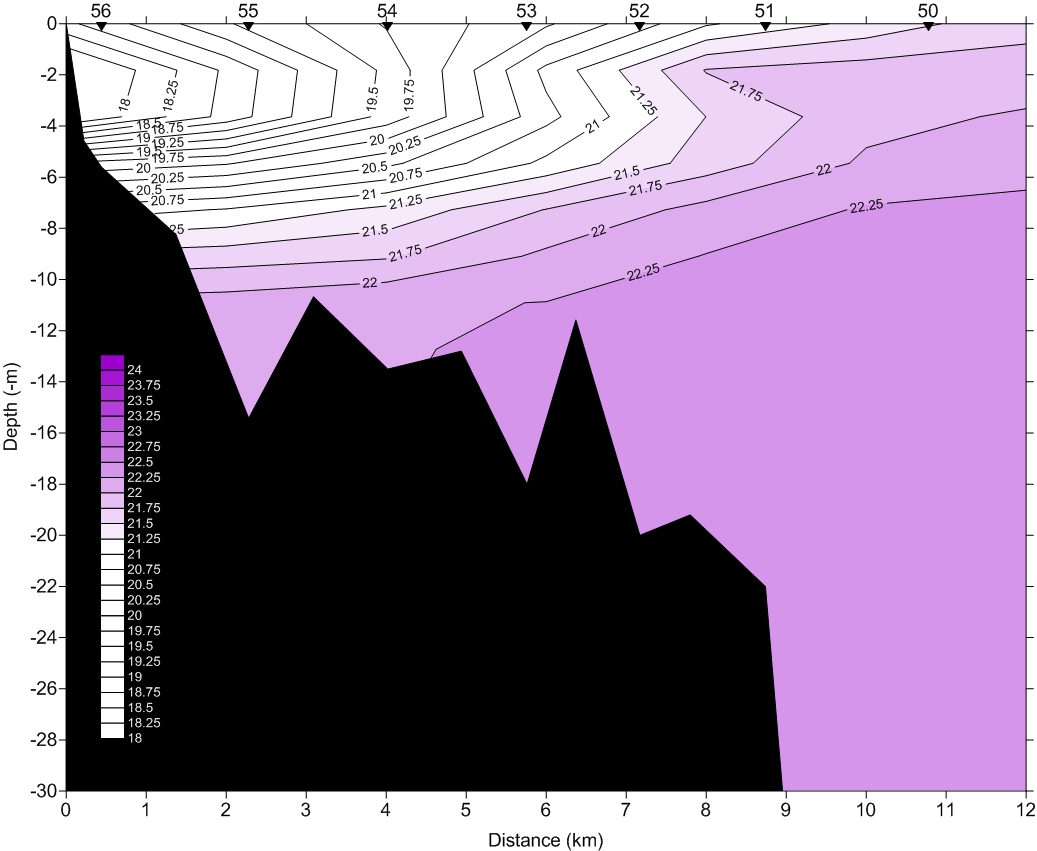
Very noticeable pycnoclines were noted at all inner and middle harbor stations, mirroring the depths of the thermoclines and haloclines. This makes sense as density is a function of temperature and salinity. Once again, this could be attributed to the relatively slow flushing rate of Quartermaster Harbor and fresh water input from local streams. The geography of Quartmaster Harbor makes the harbor sheltered which means it is less susceptible to winds.
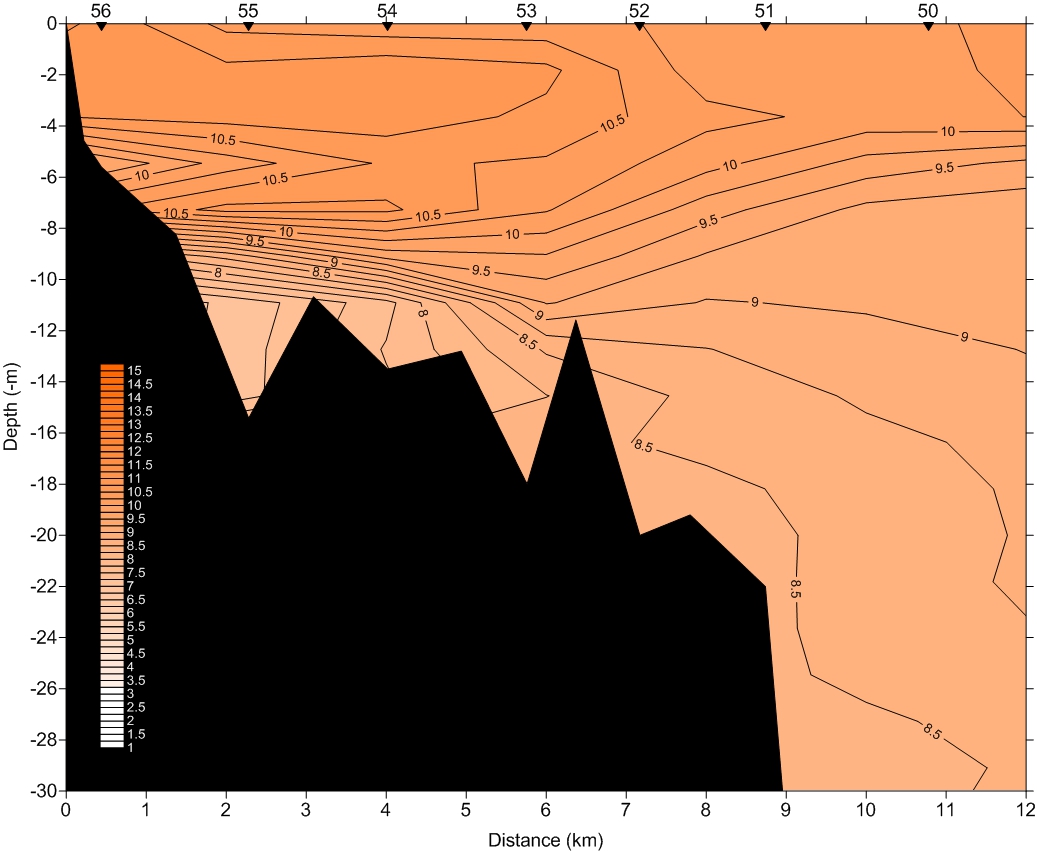
Each station showed a slight increase of dissolved oxygen between the surface and approximately 5 meters of depth. This is consistent with the CTD fluorescence data showing higher concentrations of phytoplankton at this depth. Phytoplankton, being photosynthetic organisms, generate oxygen near the surface. Inner and middle harbor stations showed a sharp decrease in DO between approximately 5-10 meters in depth. This is consistent with a decrease in phytoplankton as well as the noted thermoclines and pycnoclines. These factors would each decrease, if not eliminate, mixing throughout the water column.
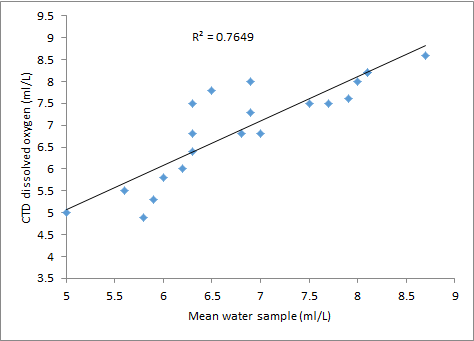
Correlation
of CTD DO levels with discrete DO water samples
showed a high correlation of determination of 0.9156.
Dissolved Oxygen Saturation (%)
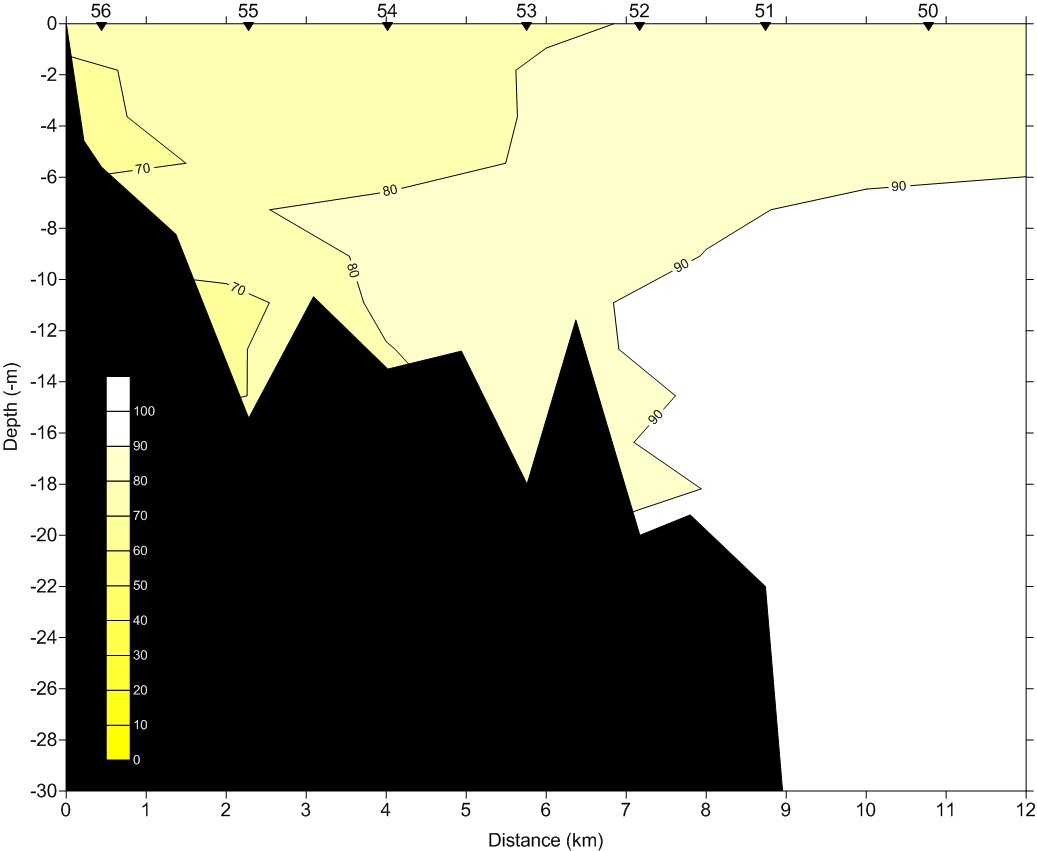
All stations showed supersaturated DO levels above approximately 8 meters of depth, with levels increasing with distance from the harbor entrance. This corresponds to the levels of highest chlorophyll, an indicator of phytoplankton concentration, in the discrete water samples. Due to the much higher level of mixing in the outer harbor stations, DO saturation levels decreased much slower with depth than at the middle and inner harbor stations.
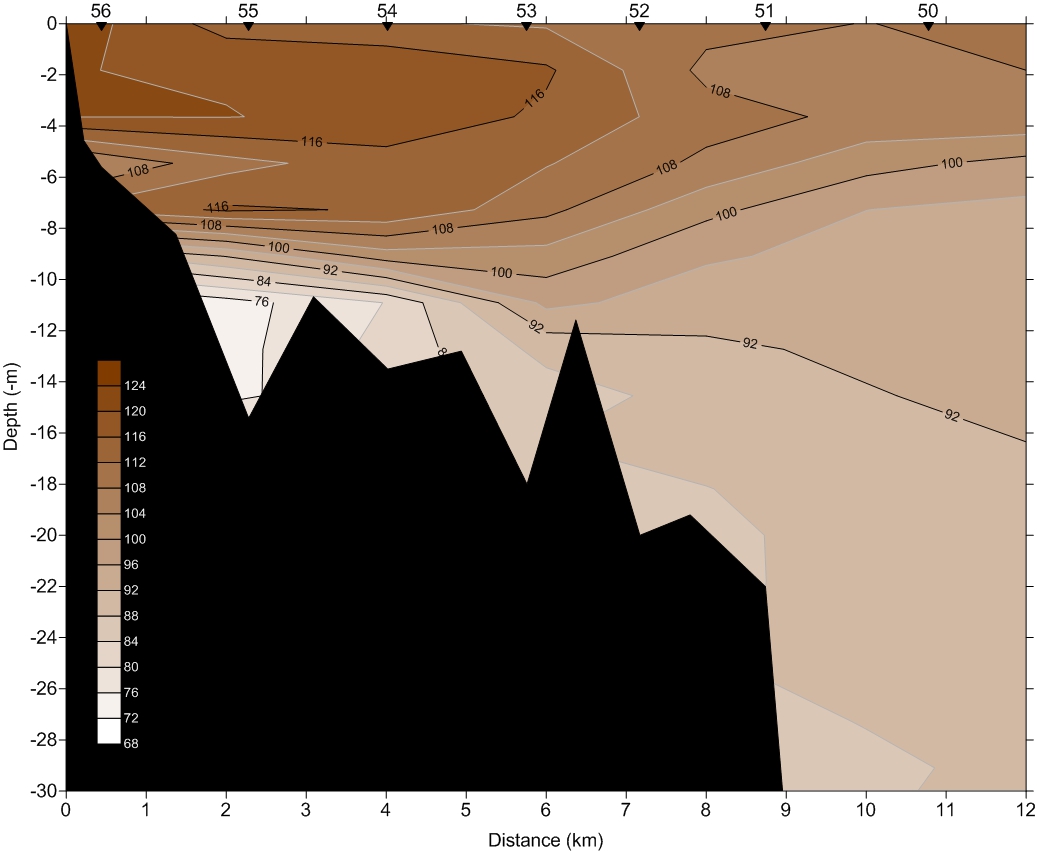
CTD
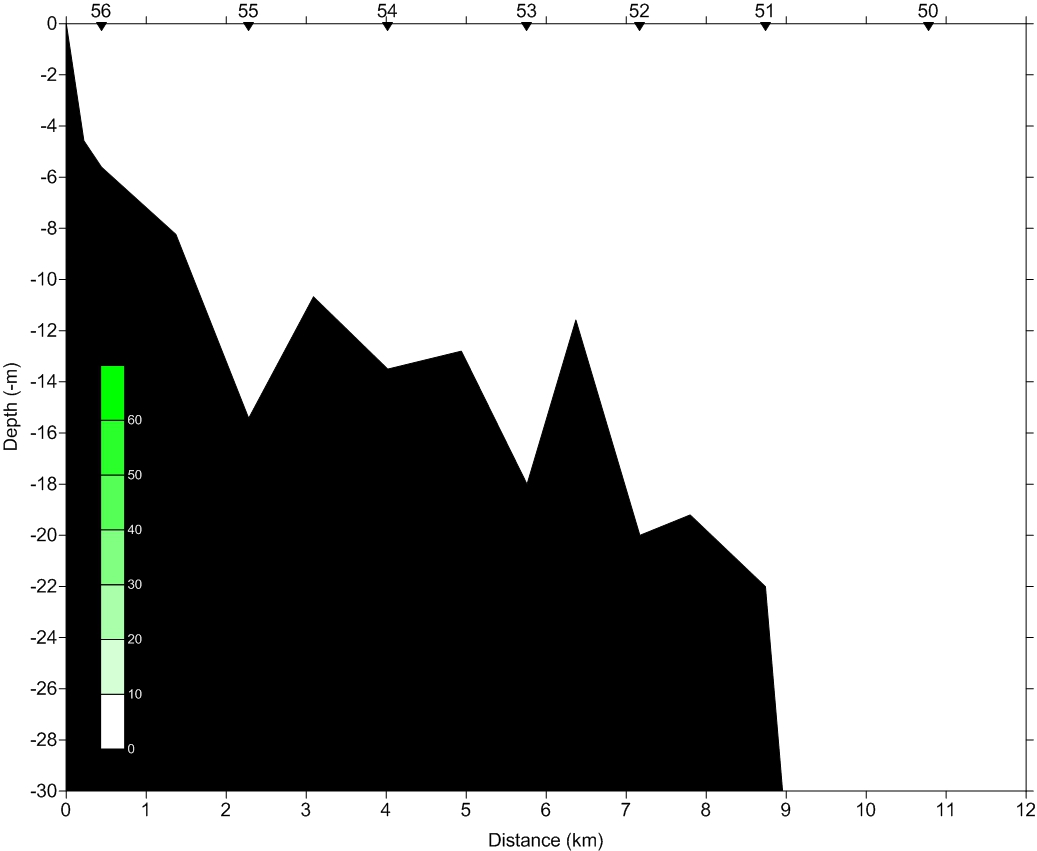
UWT Fluorometer
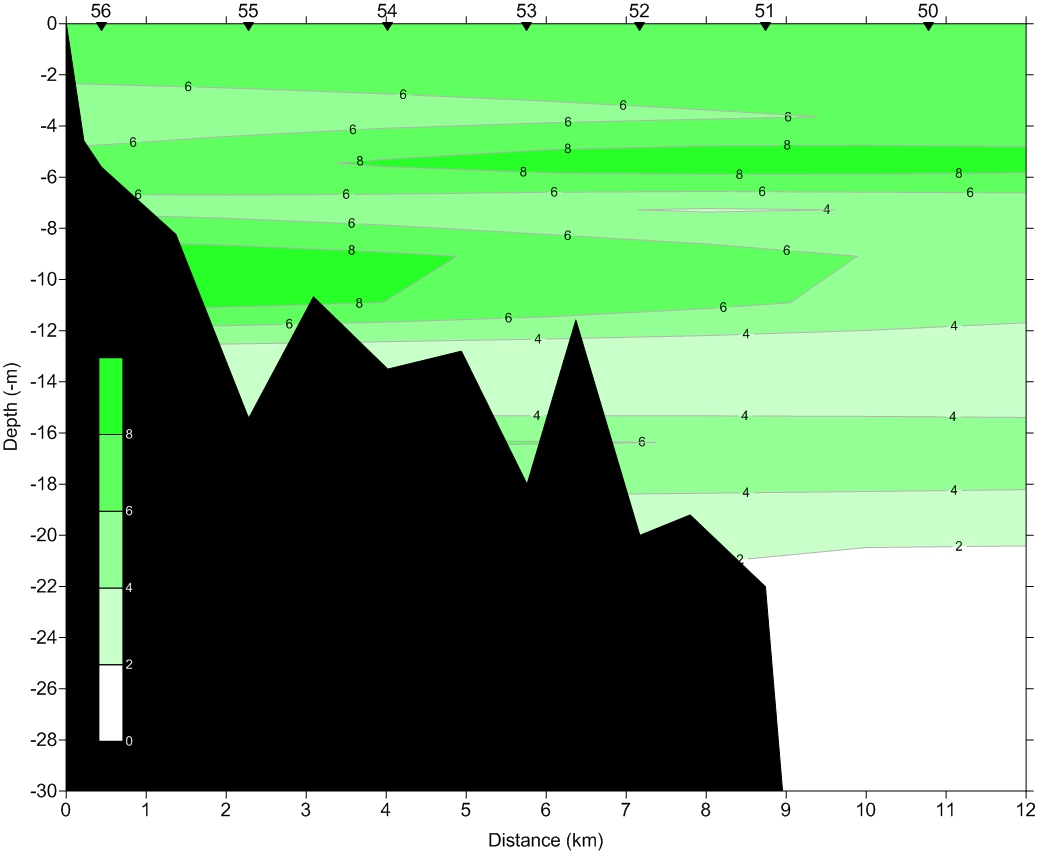
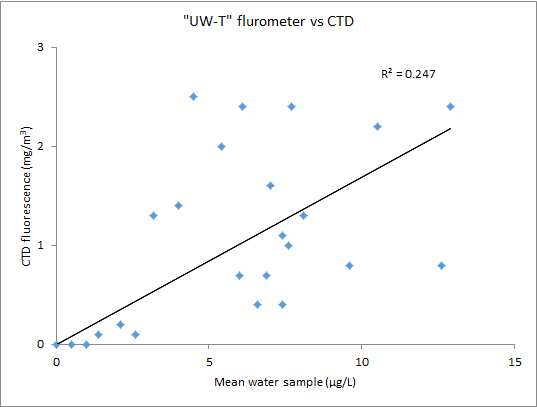
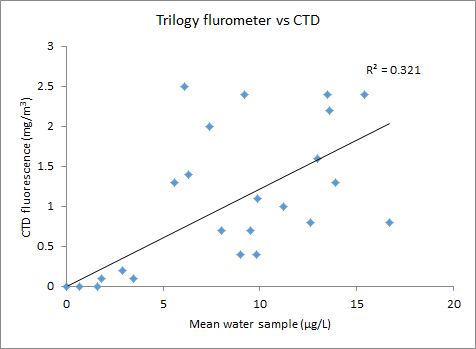
Comparisons of CTD fluorescence data and two fluorometers
 |
 |
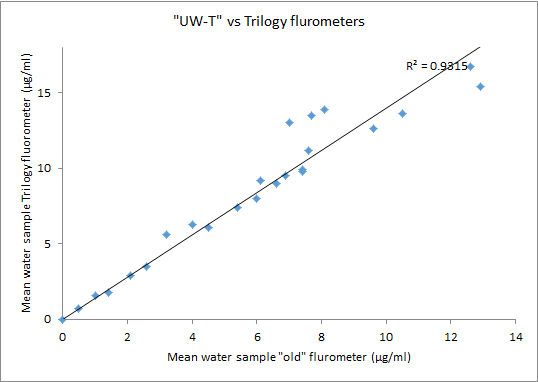 |
The CTD fluorescence data did not represent what was actually occurring in the harbor on this date. The highest level of fluorescence, 3.13 mg/m3, was measured at 4 meters of depth at station 50. The above comparisons of the CTD fluorescence data with fluorometer data for the discrete water samples show very low coefficients of determination of 0.321 and 0.247. But comparison of the two fluorometers used to analyze the water samples show a high coefficient of determination of 0.9315. Because of this, the descrete water fluorometer data was averaged for each depth and used in place of the CTD data to generate the above UWT fluorometer contour plot.
Transmissivity
showed a decreasing trend with increasing
distance from the harbor entrance.
Outer
harbor stations showed much lower variability, 84.2%-95.8%, than the
inner and
middle harbor stations, 62.5%-87.8. In
general, transmissivity decreased with distance from the entrance into
Quartermaster Harbor. The
relatively low transmissivity in the inner and middle harbor stations
corresponds with the high fluorescence and DO data, both indicators of
phytoplankton concentration.
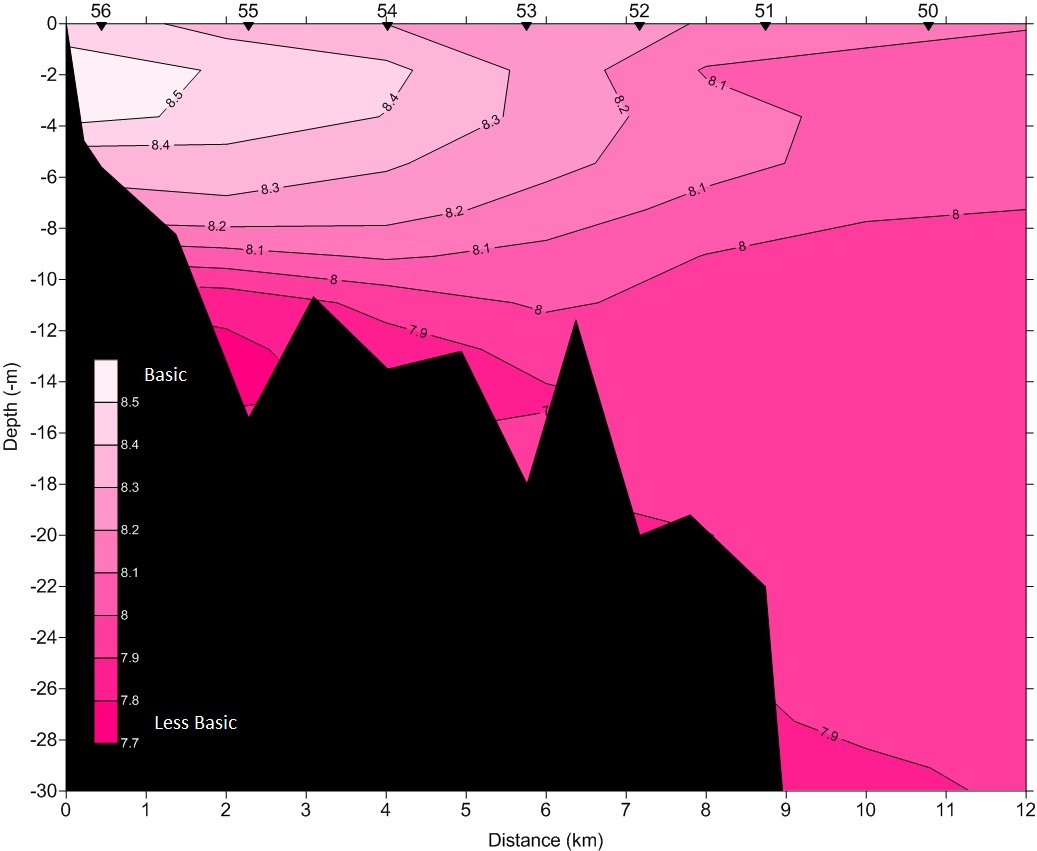
At the entrance to Quartermaster Harbor, pH showed little variability below 8 meters of depth. Below this depth, pH was approximately 7.7 to 7.8. This corresponds with values from previous research for this area and time of year (Feely et. al 2010). Inside the harbor, pH increases corresponded to high levels of chlorophyll, an indicator of phytoplankton concentration. As shown below, two genera of diatoms (Chaetoceros spp. & Thalassiosira spp.) were in high concentration on the sampling date. Diatom concentration in fresh water has been linked to increases in pH (Dixit et. al 1992).
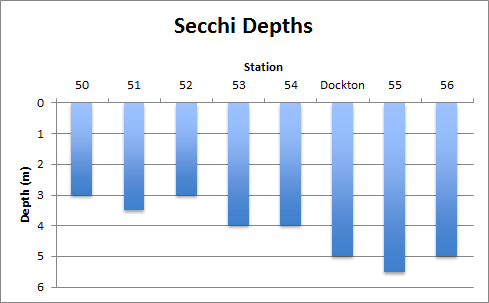
Secchi disk
measurements ranged between 3 and 5.5 meters
with an average of 4.7 meters. Depths
generally increased with distance from the harbor entrance. This does not correspond
to the CTD
transmissivity data which showed the opposite trend.
This could be due to the suspended load in the plume from
the Puyallup River which empties into Commencement Bay to the south of
Quartermaster Harbor.
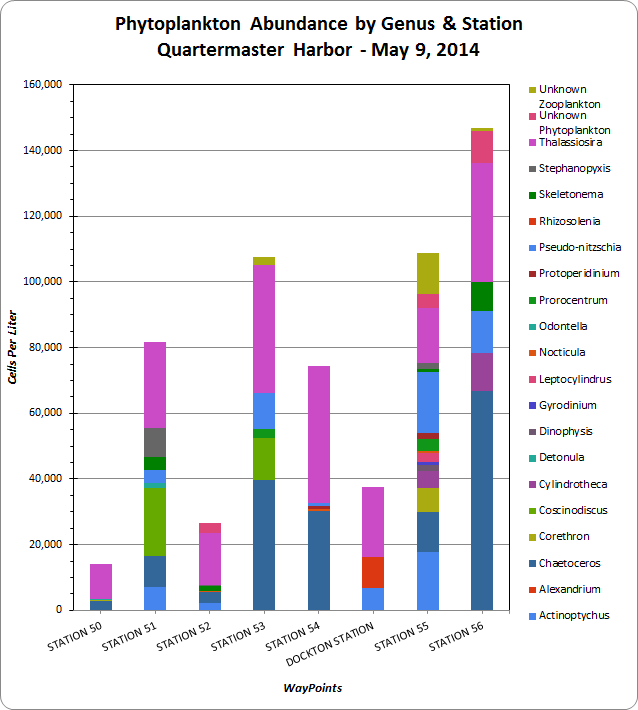
Twenty unique genera of phytoplankton were identified in the water samples. While concentration and diversity of phytoplankton varied greatly between the eight stations, Chaetoceros spp. and Thalassiosira spp. were consistently most abundant. The higher concentrations at the inner and middle harbor stations, except for dockton, correspond with the higher chlorophyll levels.
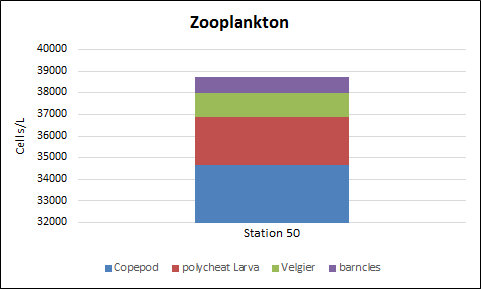
A zooplankton net capture was conducted at station 50 between 50 and 150 meters of depth with a 150μm mesh. Four separate organisms were identified in the sample.
Sediments and Total Organic Carbon
|
|
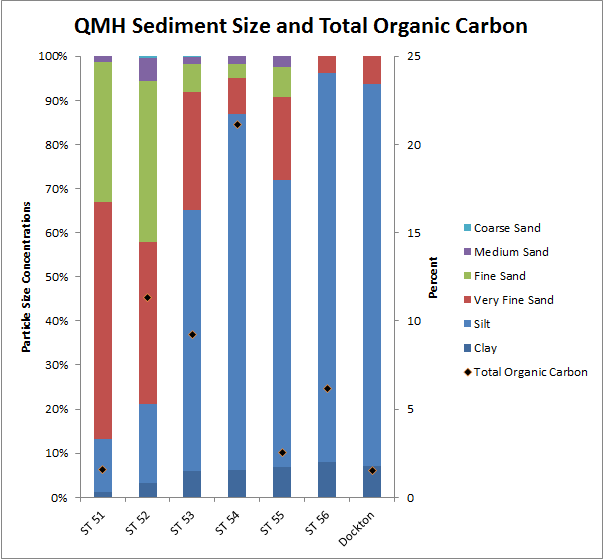 |
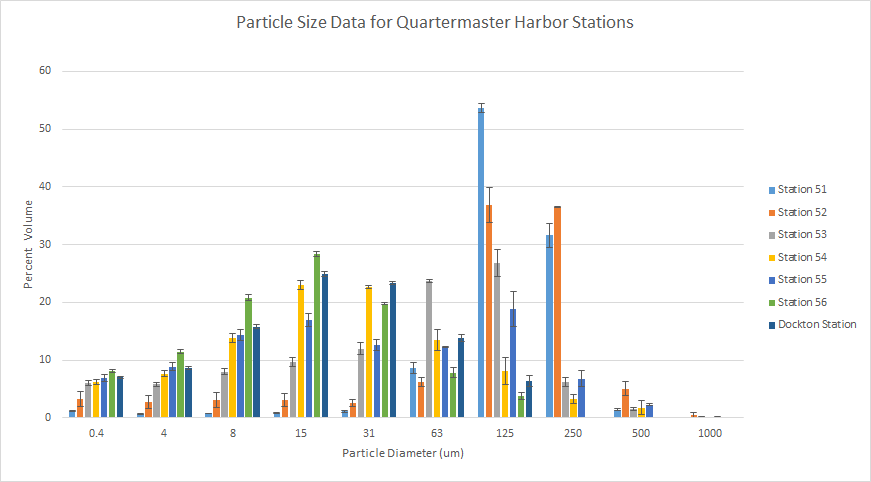
Grains ranging in
size from 0.4
to 250 μm were present in each
sediment sample. Grains above 500μm were present in five samples and
above 1000
μm only in four. Sediment
collected at the inner stations showed a tendency
toward smaller grain size, silts and clays.
Stations 51 and 52, which see a greater turbulence
due to being in the
harbor entrance, showed a much higher percentage of sands. Greater
turbulence typically keeps smaller
grains suspended and out of the sediments. Sediments at the
outer
harbor stations were classified as loamy sand. The middle
harbor
stations were silt loam. The inner harbor stations were silt.
 |
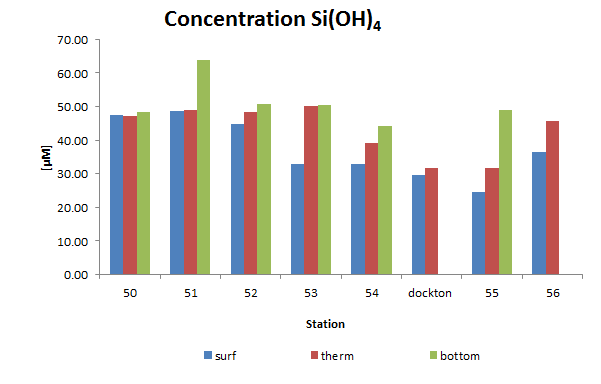 |
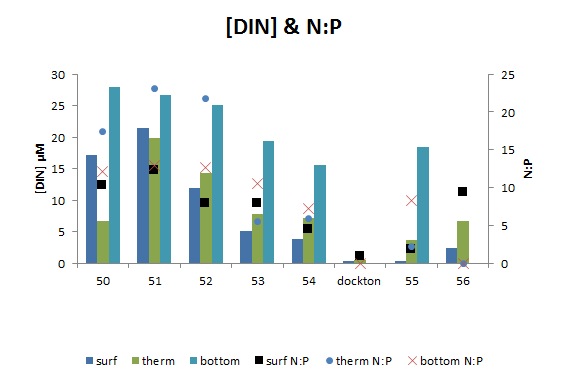
Dissolved inorganic nitrogen (DIN), PO4,
and Si(OH)4 are used by the phytoplankton
which causes concentration levels to drop. Our data is consistent in
the respect that
when phytoplankton cell counts are high, there is a decrease in
nutrients as
well. The only exception to this is Dockton Dock which we believe to be an anomaly.
Dixit SS, Smol JP, Kingston JC, Charles DF. 1992. Diatoms: Powerful Indicators of Environmental Change. Environmental Science & Technology 26(1) 22-33.
[DNR] Department of Natural Resources. 2004. Maury Island Environmental Aquatic Reserve Final Management Plan [Internet]. Olympia (WA): Washington Department of Natural Resources; [cited 2015 May 4]. Available from: http://www.dnr.wa.gov/Publications/aqr_rsve_mry_mgmt_plan102904.pdf