   |
| Main | Introduction | Methods | Results & Discussion | Data Repository |
Located south of
Admiralty Inlet, the Hood Canal is one of four main basins of which the Puget
Sound is composed. Located at the entrance of the canal is a sill that
characteristically prevents movement of water into or out of the basin. The
Hood Canal has an approximate water volume of 26.9km3 and is fed by
many rivers including the Skokomish, Hamma Hamma, Duckabush, and Dosewallips
rivers (Nelson 2003). Spanning roughly 110km the canal is relatively narrow
averaging 2.4km in width (Khangaonkar 2013). Although the Hood Canal reaches
depths of nearly 180m, the average depth from end to end is only 54m
(Khangaonkar 2013).
Due to the bathymetry of the Hood Canal – predominately the basin’s depths and
entrance sill – the flushing rates are characteristically slow (HCDOP 2005). As
a result, this basin of the Puget Sound is known to have low dissolved oxygen
levels. The low flushing rate prevents colder, more dense saltwater from mixing
with warmer, less dense freshwater.
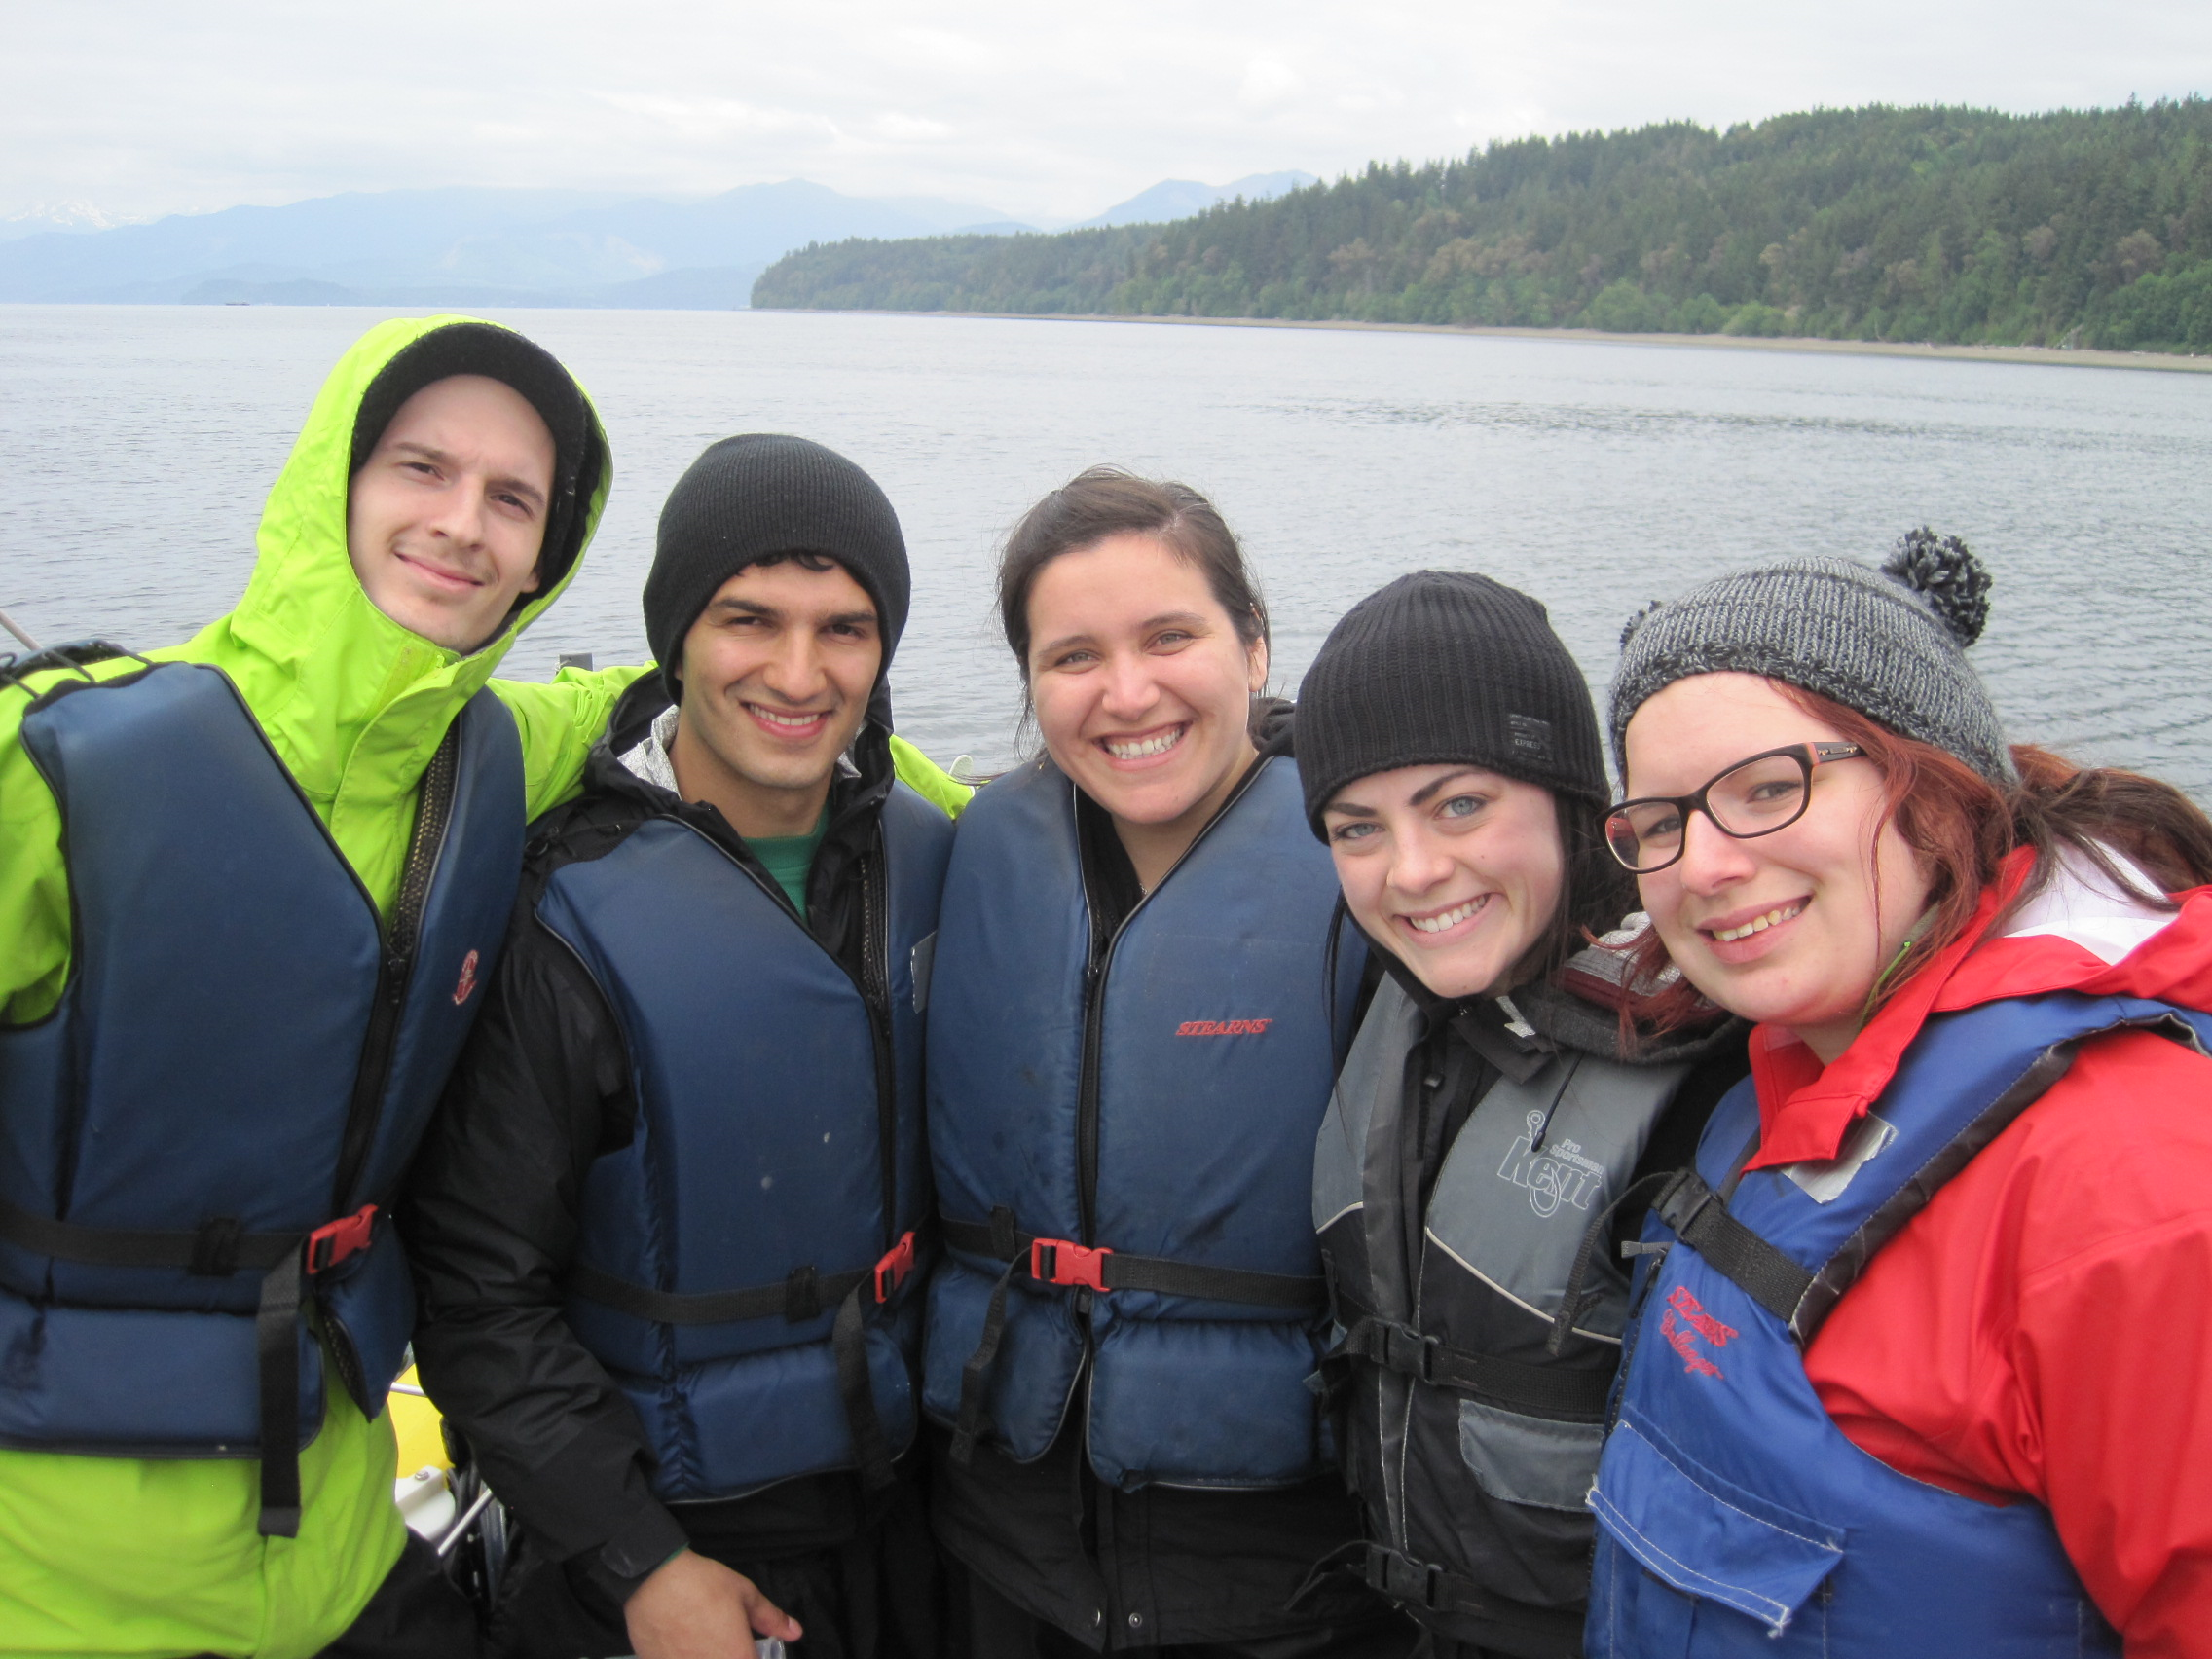
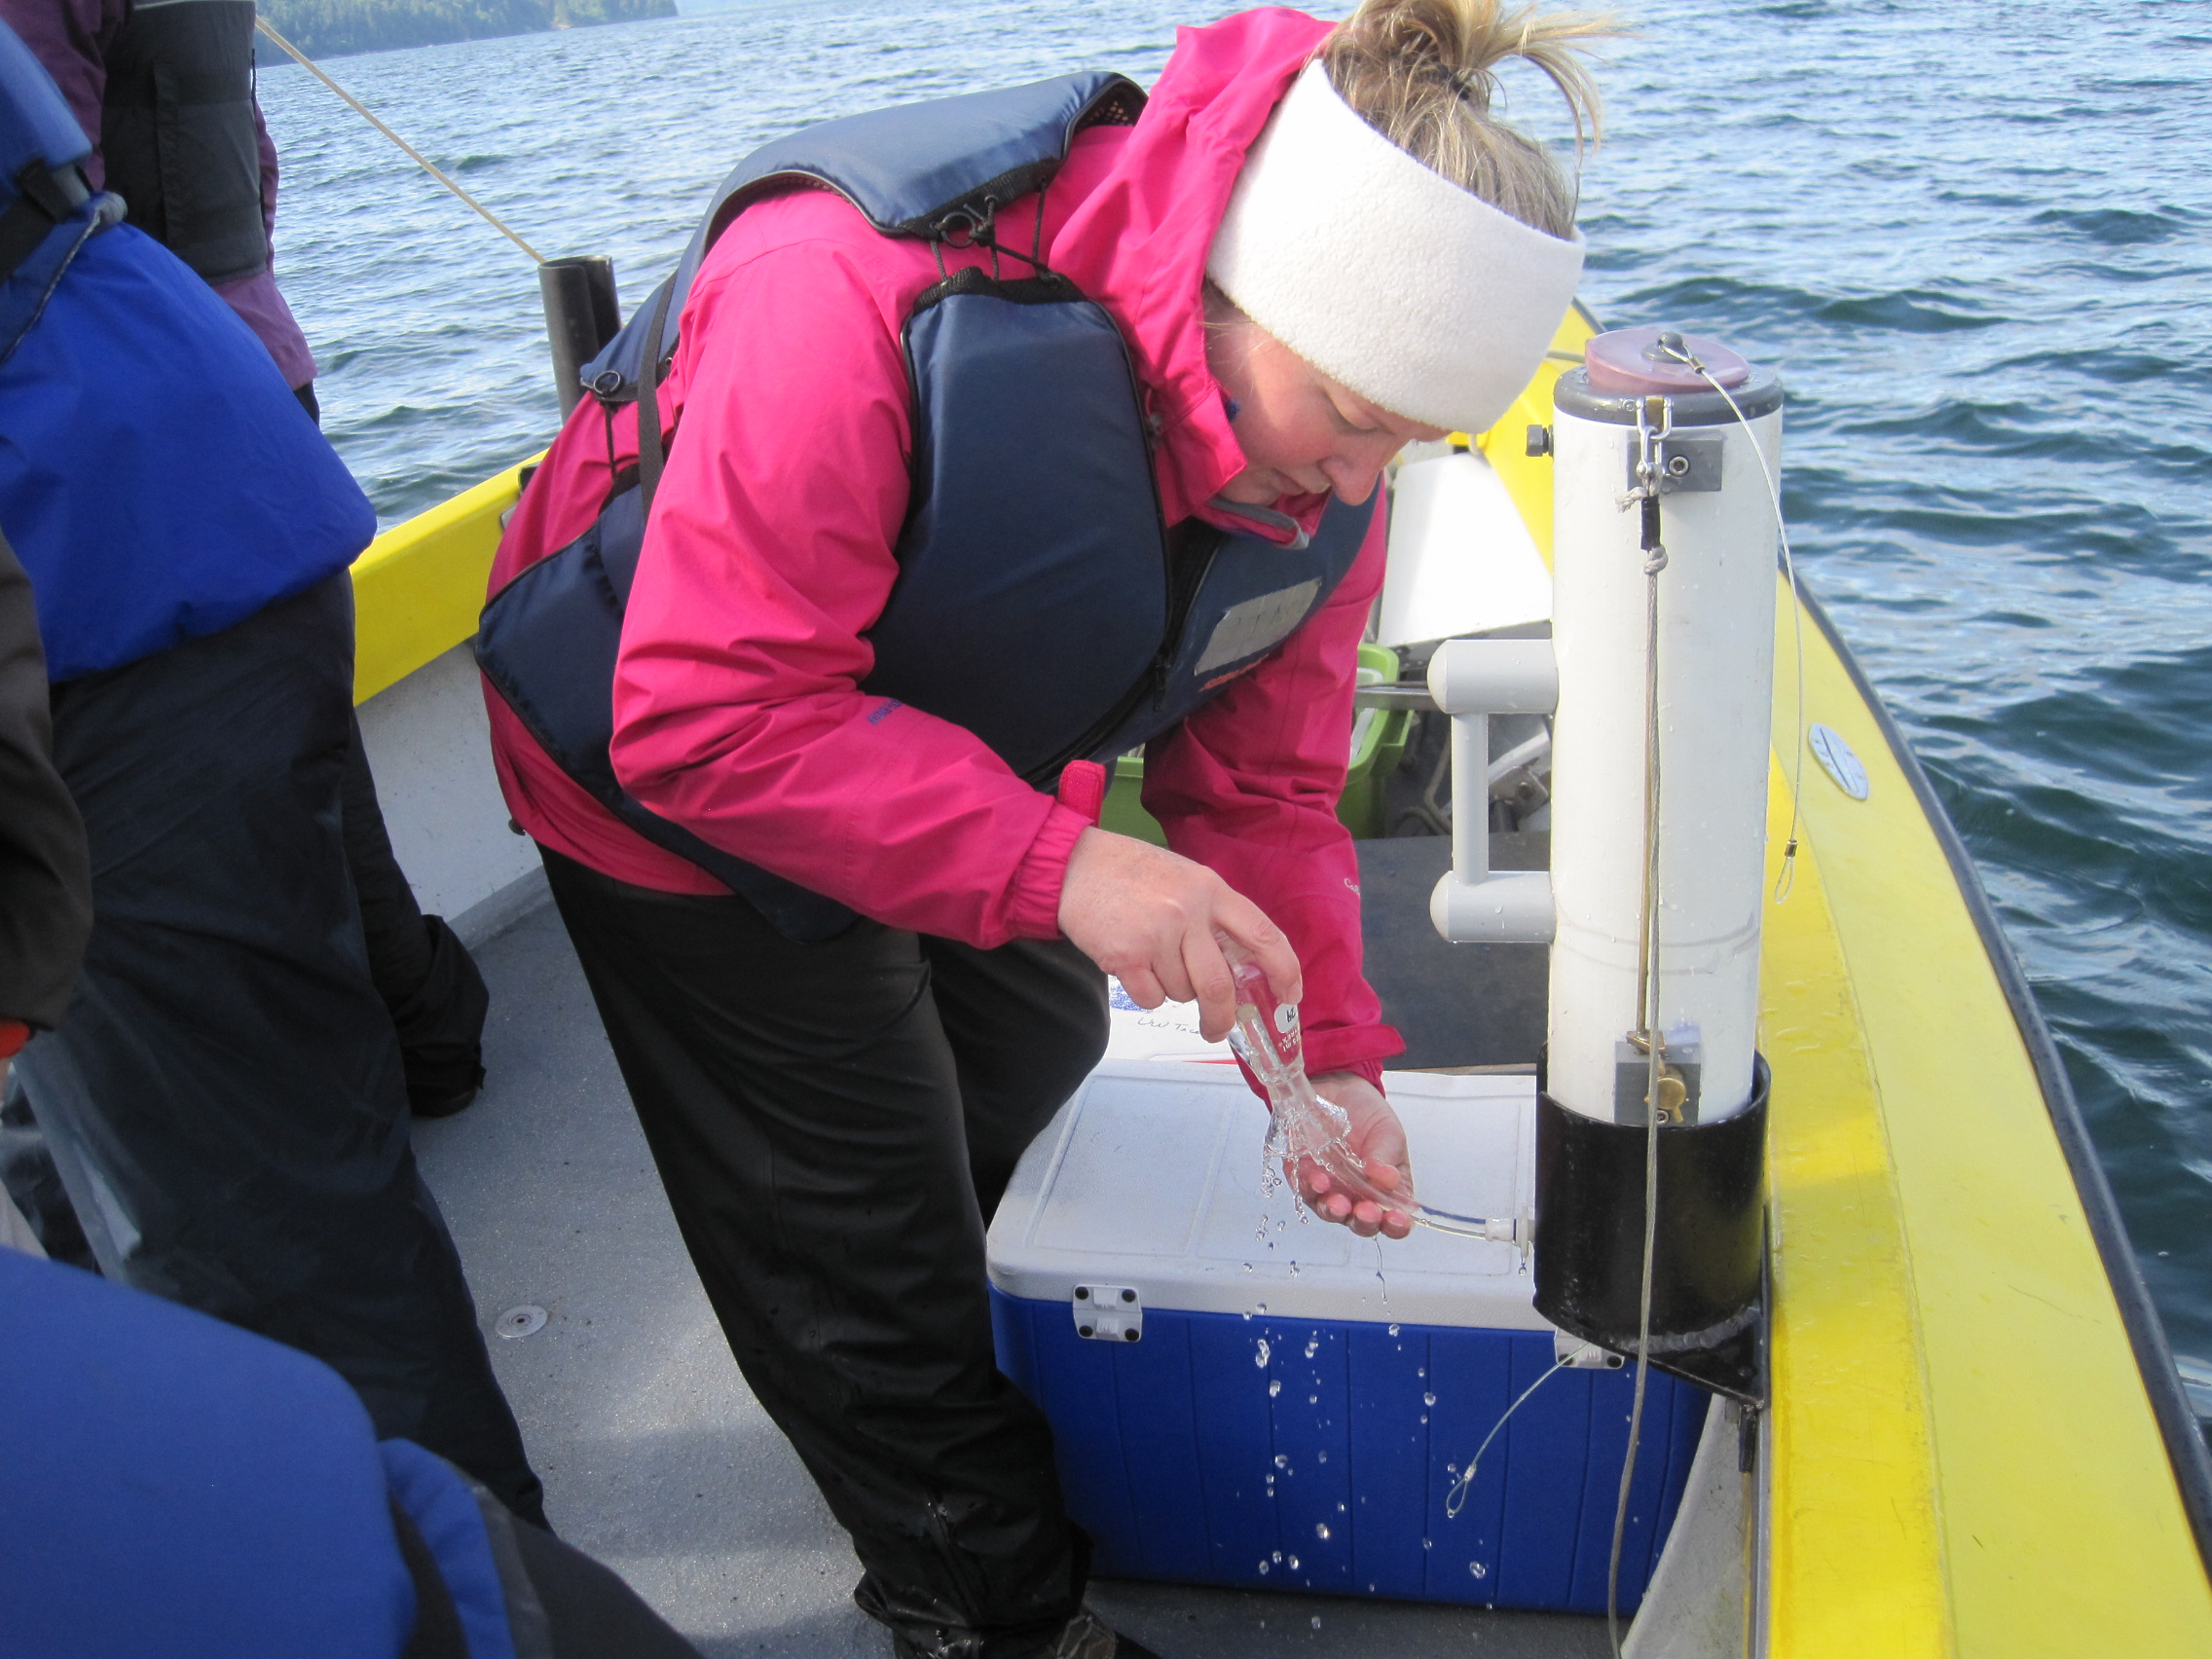
The University of Washington Tacoma’s 2014 Estuarine Field Studies
students traveled to the Hood Canal, to observe and sample water, sediments and
marine organisms on May 16 and 17, 2014. The
R/V Wealander was captained by Dave Thoreson. All students enrolled in the
Estuaries Field Studies course worked as a research team under the direction of
instructors Cheryl Greengrove and Julie Masura. Three TA’s also assisted in
laboratory worked conducted at Big Beef Creek. The Wealander embarked from
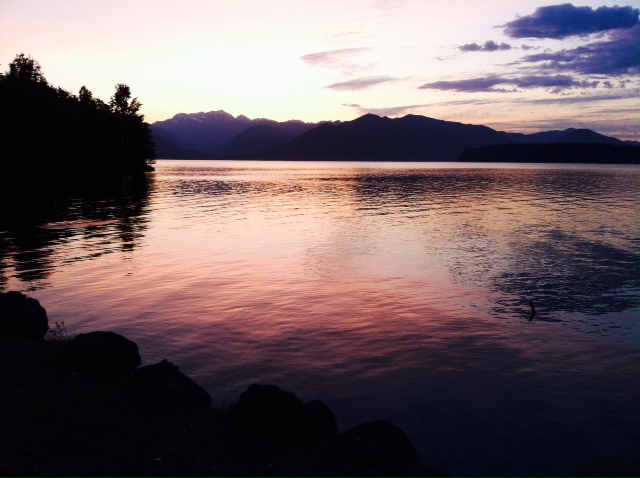
Seabeck Beach at 8:23 PDT on May 16. On the second day of sample collection,
the Wealander departed from Misery Point at 7:51 PDT. Weather conditions varied
from morning to afternoon on the first day of sampling; initially there was
100% cloud cover with smooth waters followed in the afternoon by sun and heavy
winds. On May 17, the weather varied from sunny to cloudy with minimal winds. Samples
and data collected on the Wealander were processed in the University of
Washington’s Big Beef Creek cabins in a temporary lab. Data and samples
analyzed included: temperature, salinity, dissolved oxygen,
fluorescence/chlorophyll a, transmissivity, relative turbidity,
nutrients, phytoplankton, and sediments/total organic carbon. The Hood Canal
provided an opportunity for students to learn about water properties within a
narrow canal that is notorious for low oxygen levels and high nutrient concentrations. |
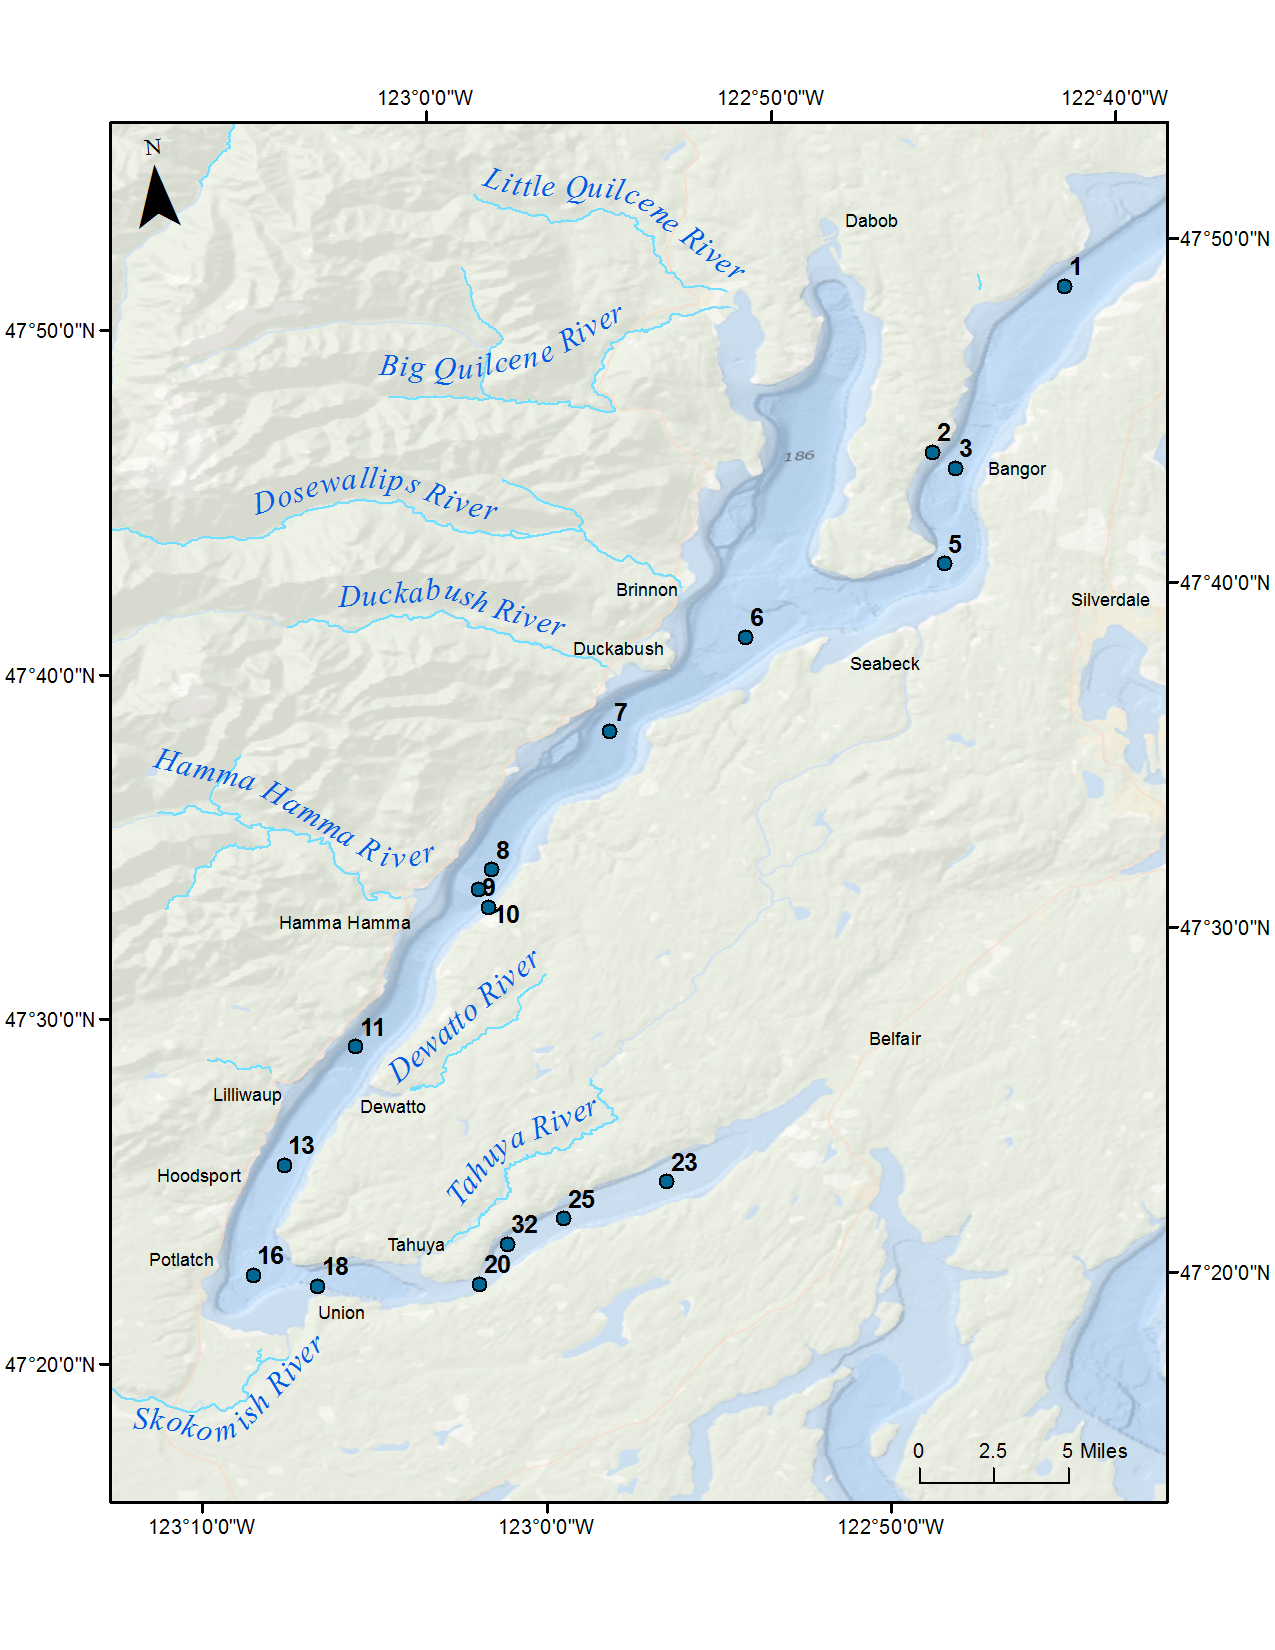 | Hood Canal Waypoints 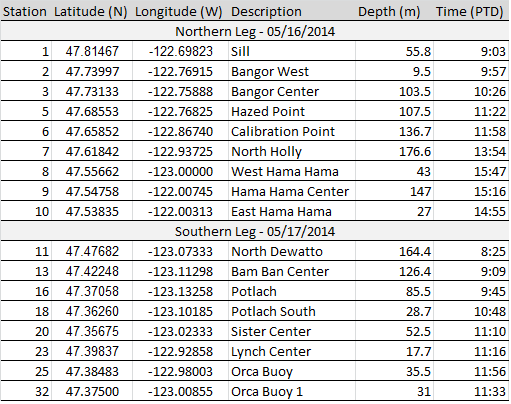 |
Sample Collections by Station 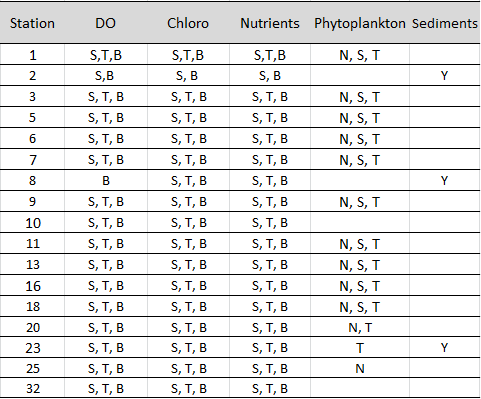 Key: S=surface, T=thermocline, B=bottom, N=net, Y=yes | ||
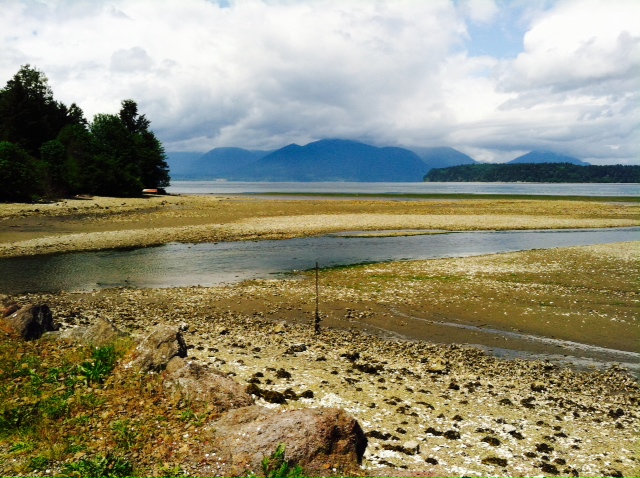
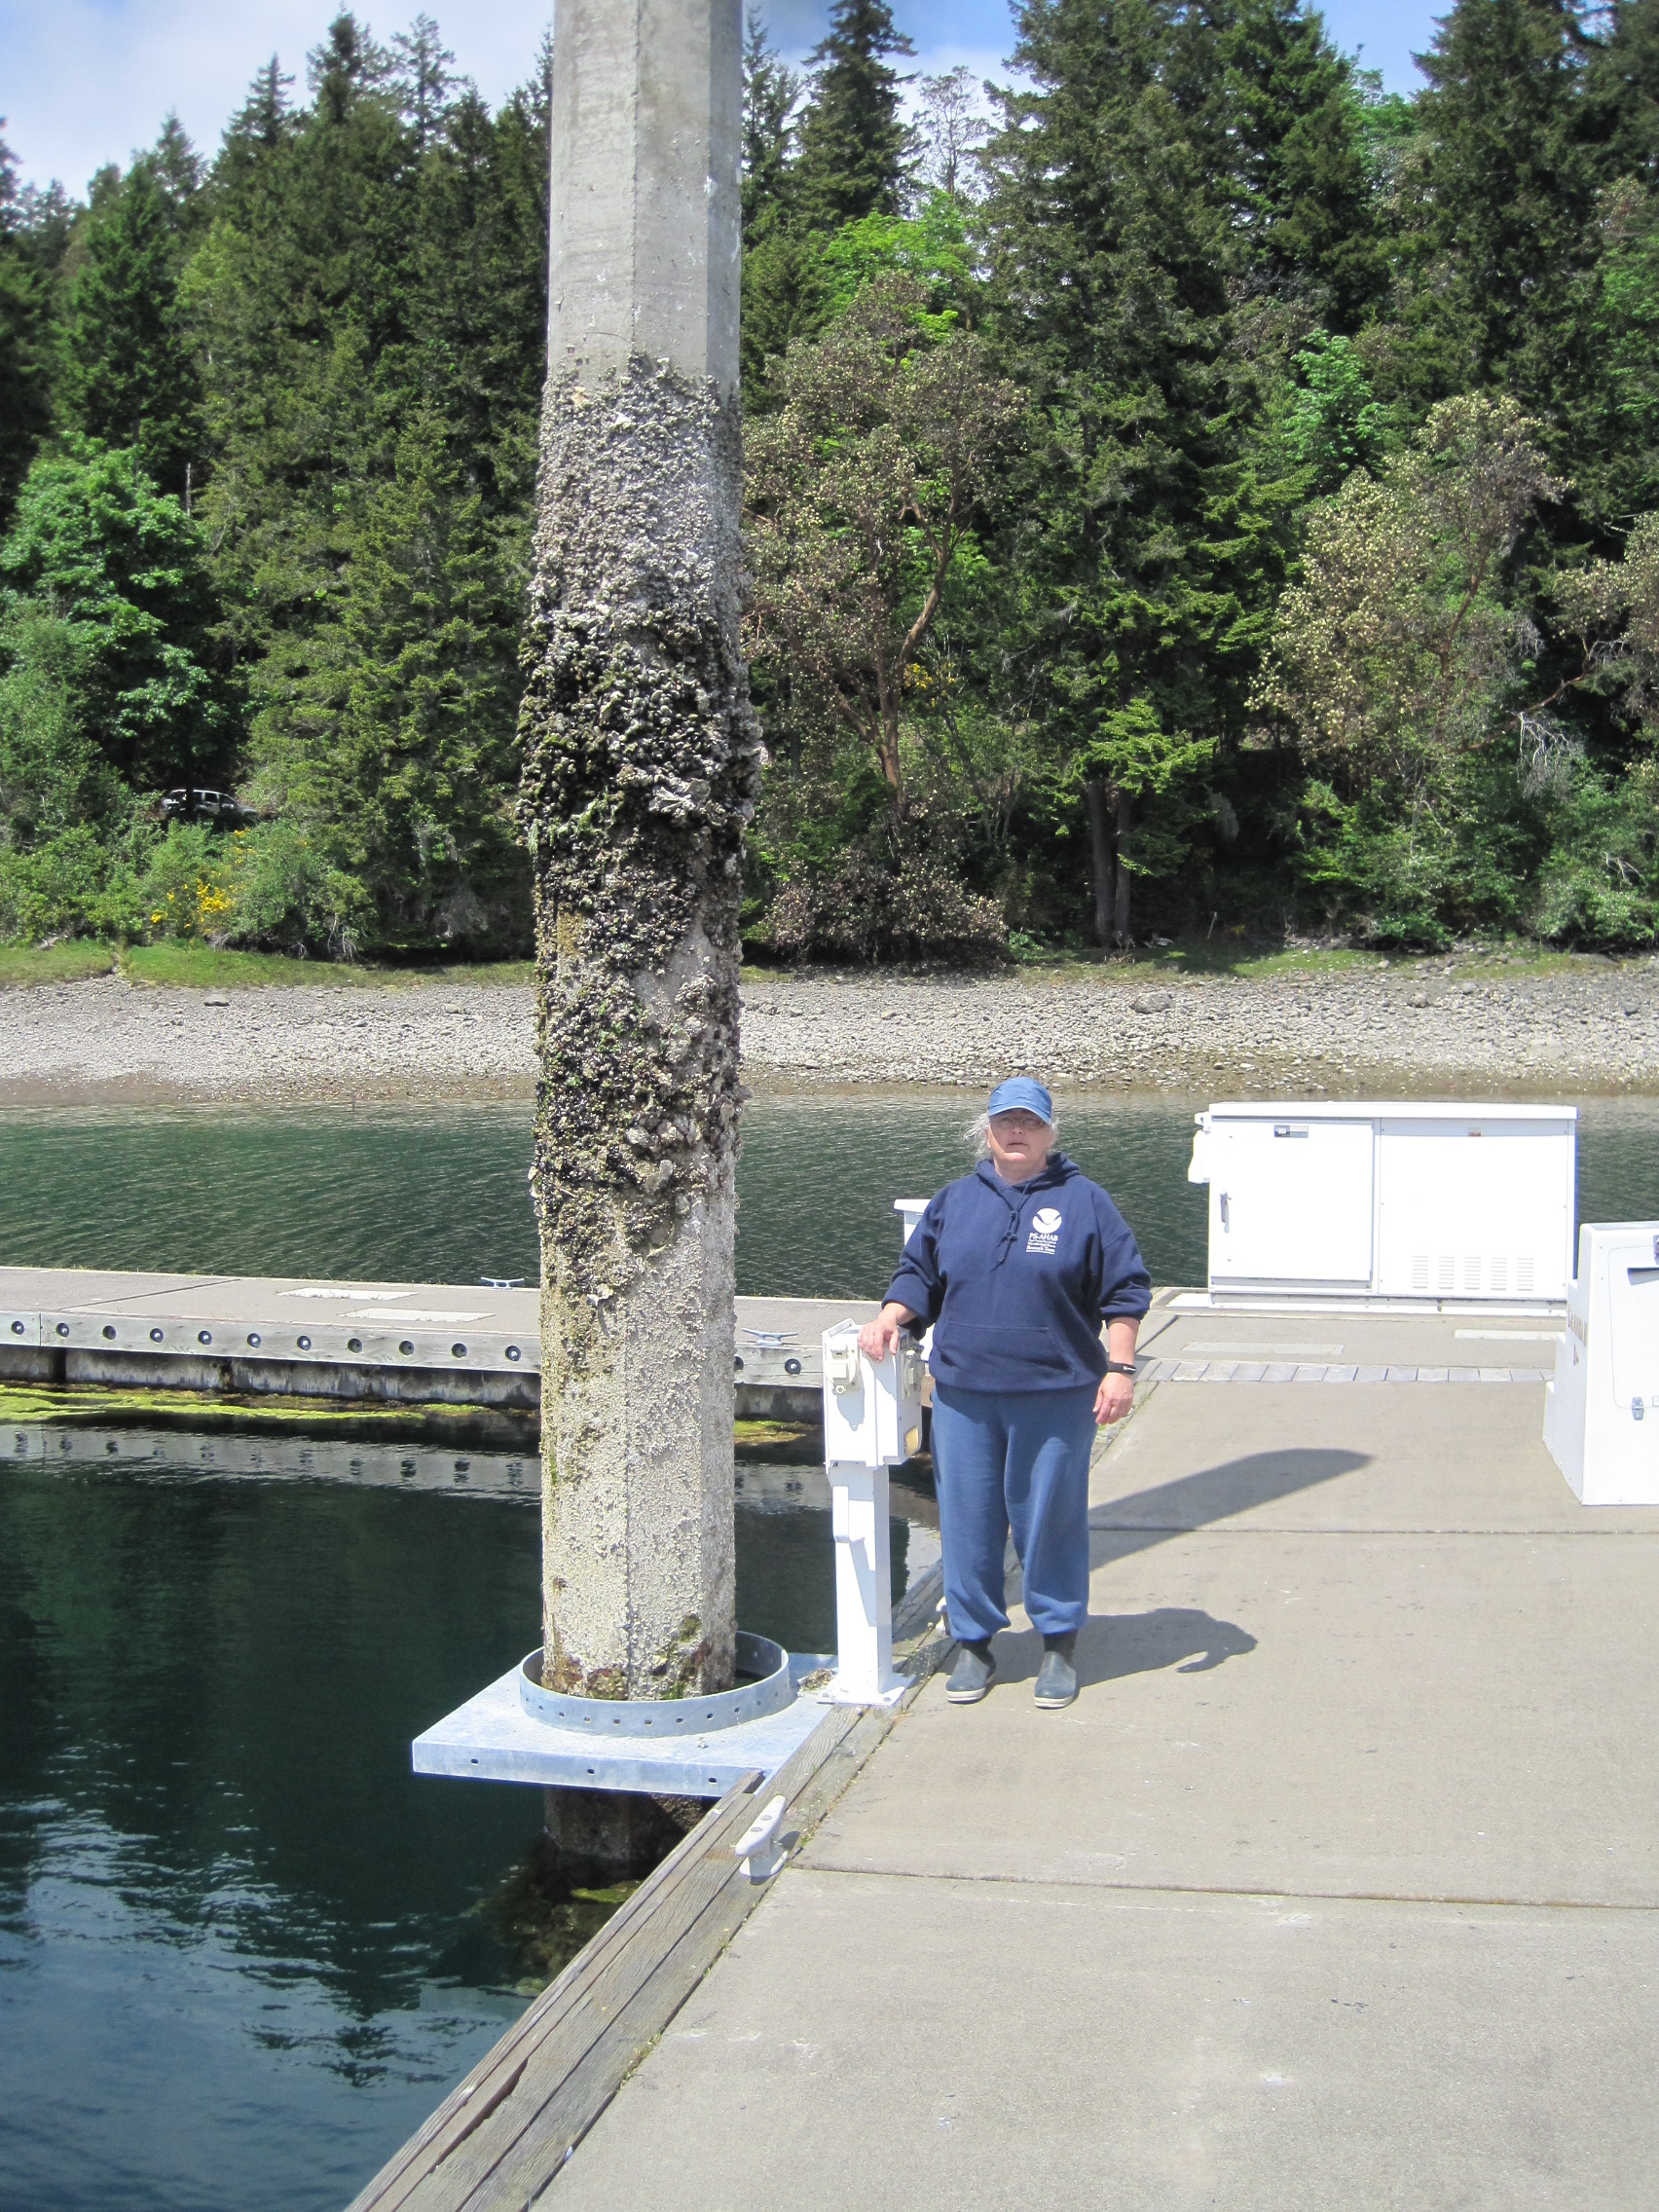 Extreme tidal exchange observed at Pleasant Harbor using Dr. Cheryl Greengrove (5'0" tall = 1 Greengrove unit) as a visual reference | Hood Canal Tidal Exchange (Lynch Cove)
tidesandcurrent.noaa.gov The Hood Canal is notorious for
extreme differences in water level at high and low tide. On the first day of
sampling (05/16/2014) a tidal exchange of nearly 15 feet was observed within
the Hood Canal. A similar tidal exchange was observed on the second day of
sampling (05/17/2014). With such large volumes of water flowing into and out of
the Hood Canal each day, it would seem peculiar that the basin is known for
depleted oxygen levels. The depth of the Hood Canal beyond the entrance sill, combined
with its length can explain why less dense, warm, freshwater flows into and out
of the canal while deoxygenated, dense water settles on the bottom. | |
Skokomish River - Flow Rate for May 2014 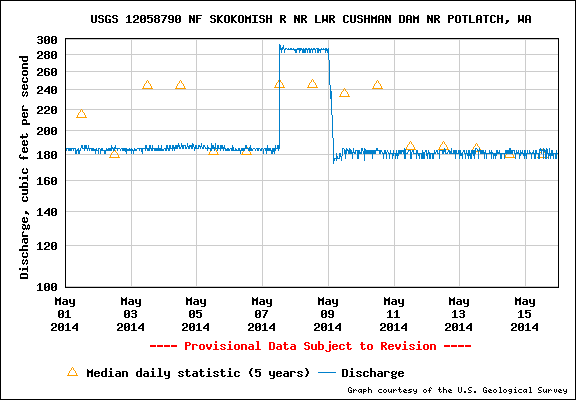 | Little
Quilcene
River Mouth - Flow Rate for May 2014 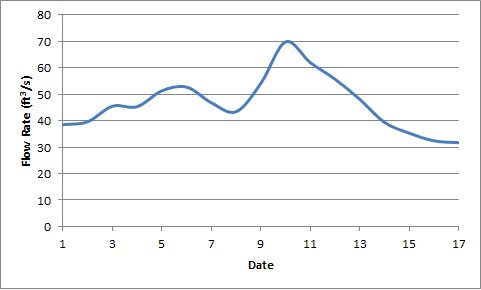
www.fortress.wa.gov | |
|
Data concerning the inflow of
freshwater from rivers into the Hood Canal could only be obtained for the
Skokomish and Little Quilcene Rivers where flow meters are currently used to
observe freshwater inflow rates. Between 05/07and 05/09 the Skokomish River
flow rate increased from nearly 190 ft3/s to approximately 290 ft3/s,
before returning to its characteristic flow. A spike in flow rate for the
Little Quilcene River was observed between 05/09 and 05/11. These spikes in
river flow rates occurred approximately a week prior our sampling along the
Hood Canal. This data in conjunction with slow outflow rates provides a cause
for the prominent stratification observed on the sampling days. | ||
 noaa.gov |
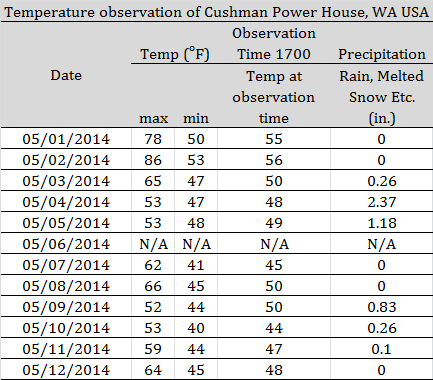
Temperatures observed prior to
sampling suggest a cause for the increase of freshwater flow into the Hood
Canal from rivers such as the Skokomish and the Little Quilcene. Early in the
month temperatures reached 85°F. Such high temperatures allow for snow to melt
in the Olympic Mountains, which drains into streams that feed the larger rivers,
eventually emptying into the Hood Canal. An increase in snow melt adds volume
to rivers, ultimately increasing the flow rate of the rivers. Temperature data observations made at Cushman Powerhouse
2, which is located approximately 4.5 km south of Hoodsport 4.5 km north of the mouth
of the Skokomish River were used to compare to river flow rate data observed in the area. | |
 |  |  |
Nelson J. 2003. Physical and Biological Oceanography of Puget
Sound [Internet]. [cited 6 Apr 2014]. Available from: http://www.cev.washington.edu/lc/CLFISH497/Web5.html
Tarang Khangaonkar. Taiping Wang. 2013. Potential alteration
of fjordal circulation due to a large floating structure—Numerical
investigation with application to Hood Canal basin in Puget Sound, Applied
Ocean Research 39: 146-157.
Hood Canal Dissolved Oxygen Program (HCDOP). 2005. [internet] Accessed May 20, 2014. Available from: http://hoodcanal.washington.edu/
| Main | Introduction | Methods | Results & Discussion | Data Repository |
This page created by Richard Davis & Alison-Marie Dunn (Johnson)