|
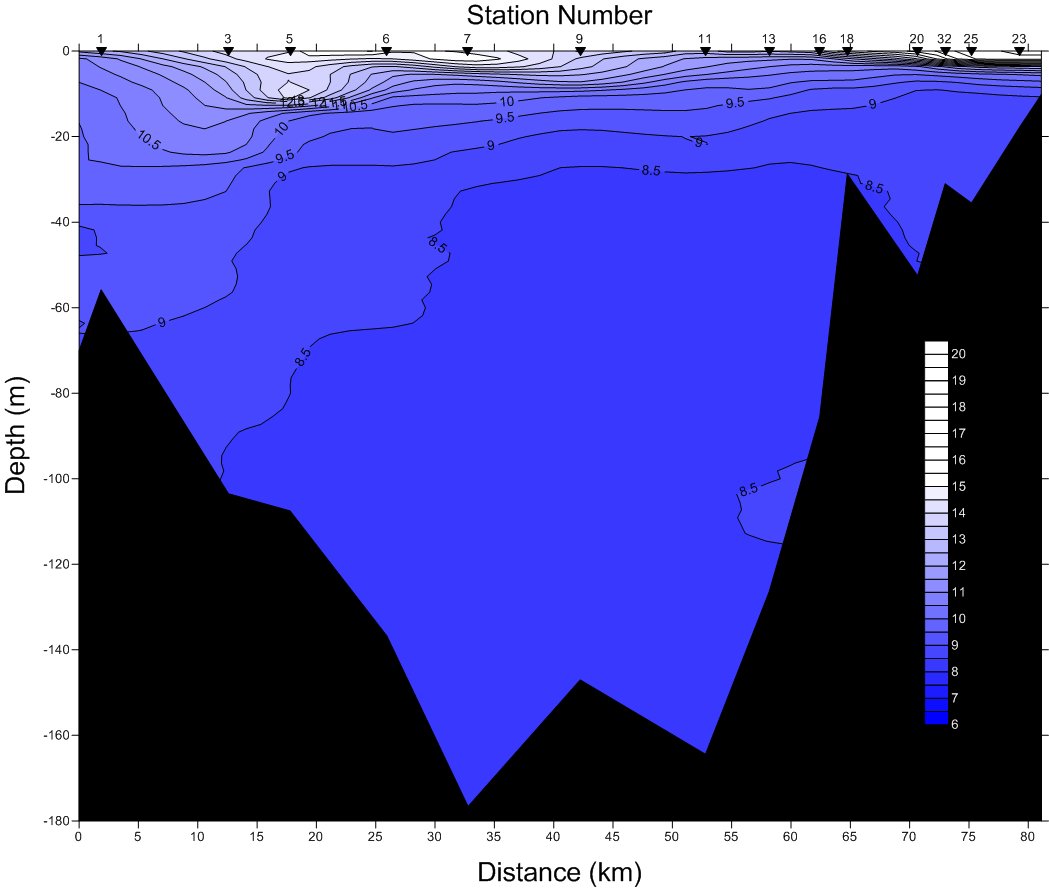
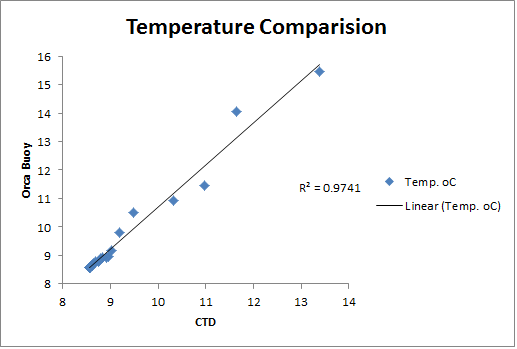
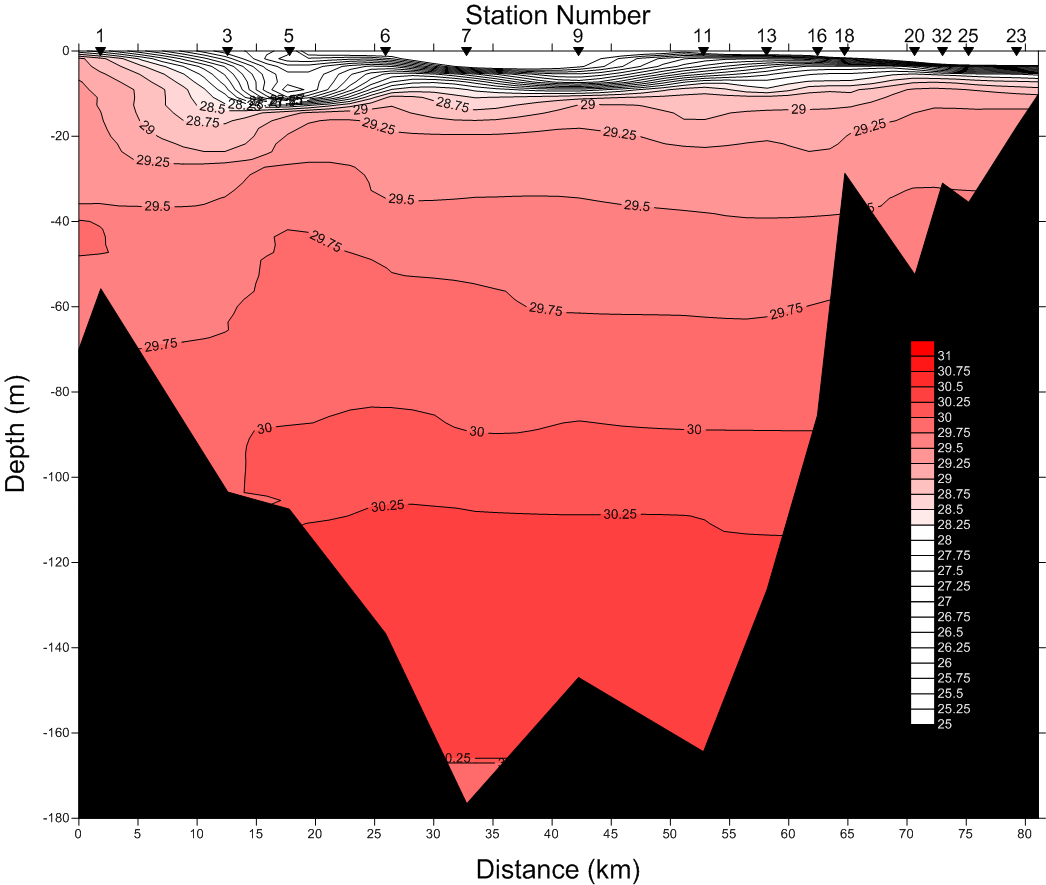
The temperature profile transect of Hood
Canal shows cold dense saltwater settling near the bottom of the basin and the
warmer freshwater near the surface. Near the northern entrance sill
(station 1)of Hood Canal, the mixing of cold and warm water is more prevalent
and the presence of a thermocline is less pronounced. In the southern
half of the basin, a temperature gradient formed due to a lack of efficient
water mixing. This temperature gradient results in a thermocline located
between 3 and 8 meters in depth.
|
Salinity Profile (PSU)
 |
|
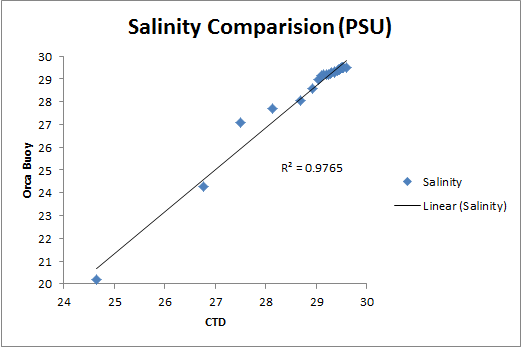
The salinity profile of Hood Canal displays
efficient mixing of water in the northern half of the basin with no halocline
forming. In the southern half there is a definite salinity gradient with
a halocline forming at between 5 and 10 meters. The sill at the mouth of
Hood Canal (station 1) is restricting the water from flowing into the mouth of the canal
allowing circulation of the waters to be strong in the northern half. In
the southern half there is no circulation due to the deep fjord basin of Hood
Canal, and there is a halocline forming between the saltwater resting beneath
and fresh water on the top.
|
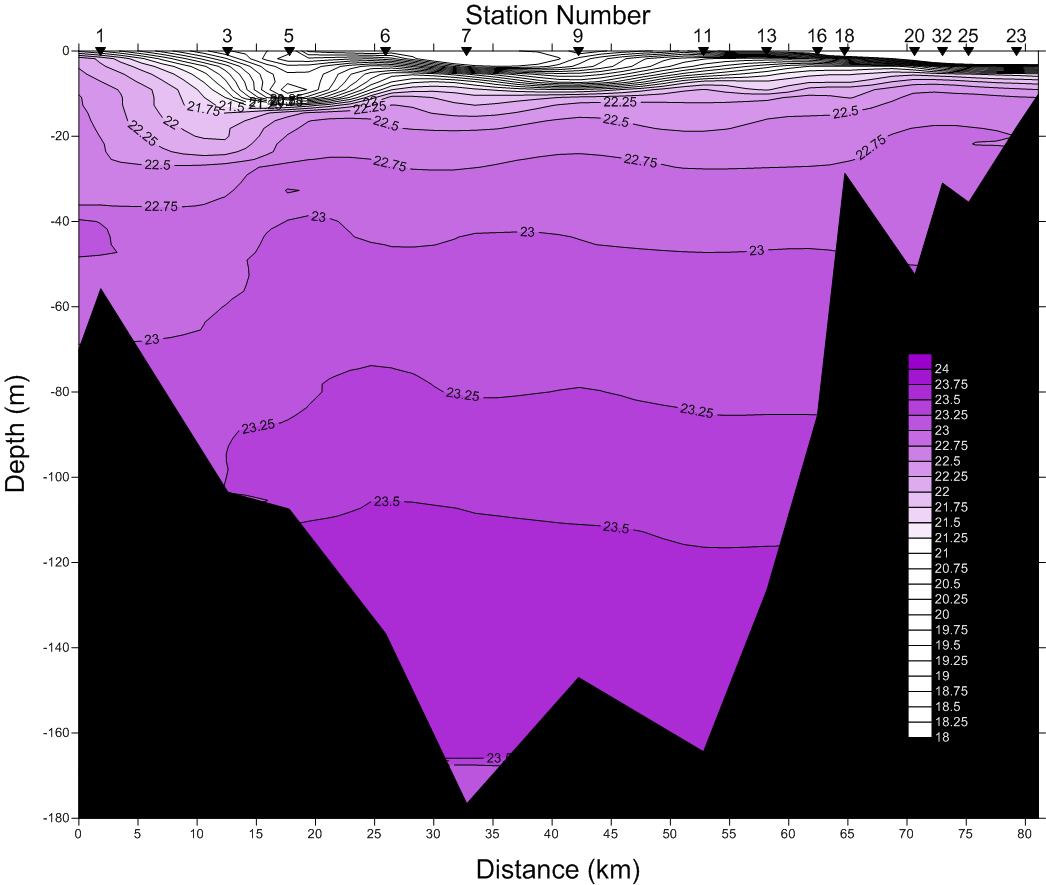
Density Profile (σt
)
 |
|
This
density profile displays dense, cool saltwater at the bottom in the southern
half where no mixing is occurring. In the northern half dense
saltwater is mixing with less dense fresh water. In the southern half of
the basin the cool, more dense saltwater has settled beneath the warmer, less
dense freshwater. When comparing the density profile to the temperature and
salinity profiles, it is apparent that density is being driven by salinity as
opposed to temperature. Due to increased temperatures and tributary inflows
(see introductory page) occurring a week prior to sampling, a snow melt
originating in the Olympic Mountains to the west of the basin had increased
freshwater flow into Hood Canal. Inadequate mixing caused by the basin’s low
flushing rate, allows for a thick layer of freshwater to rest near the surface
resulting in stratification, particularly in the southern end of the canal.
|
Transmissivity Profile (%)
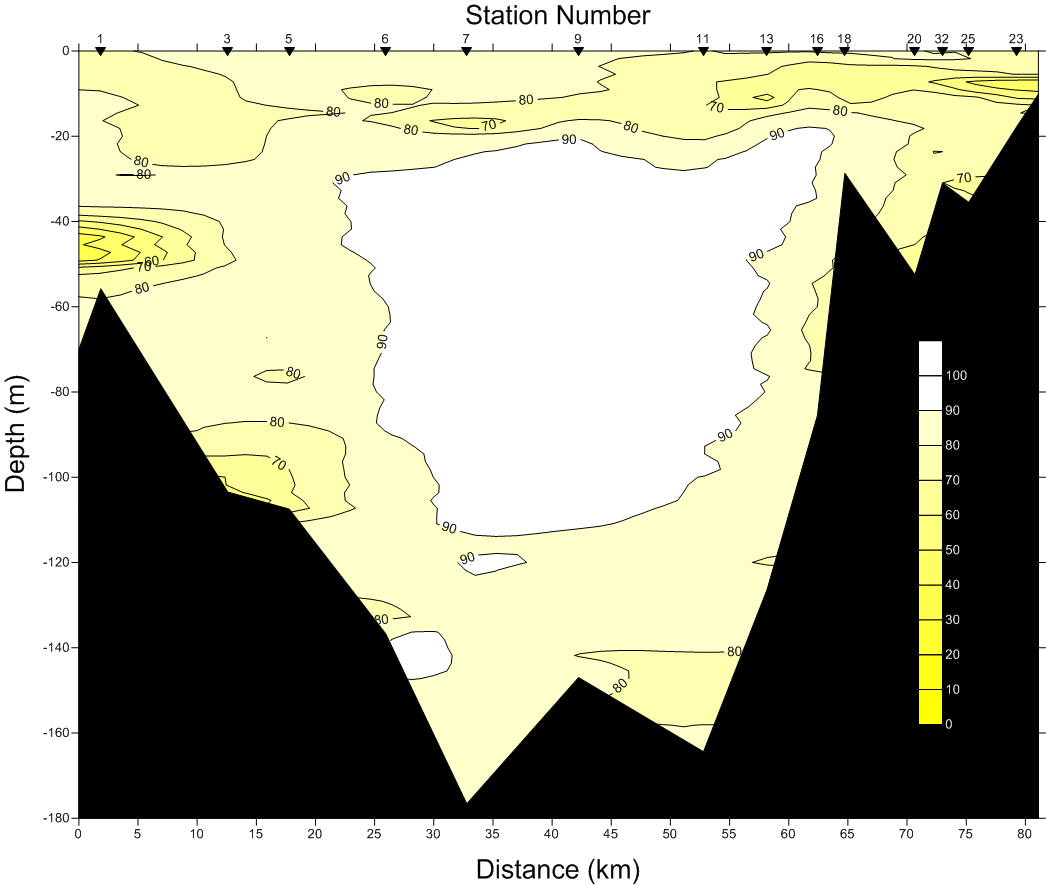 |
This
transect plot shows the transmissivity
profiles reproduced from CTD data from both the northern and southern
legs of
the Hood Canal cruise. Transmissivity is related to turbidity in
that
both are non-discriminant measures of suspended particles within
the water
column. Percent transimissivity is high above the entrance sill
(station 1) due to turbulence caused by incoming/outflowing water
from the basin. Percent transmissivity near Lynch Cove (station 23) is
high and is related to fluorescence resulting from a massive
phytoplankton bloom.
|
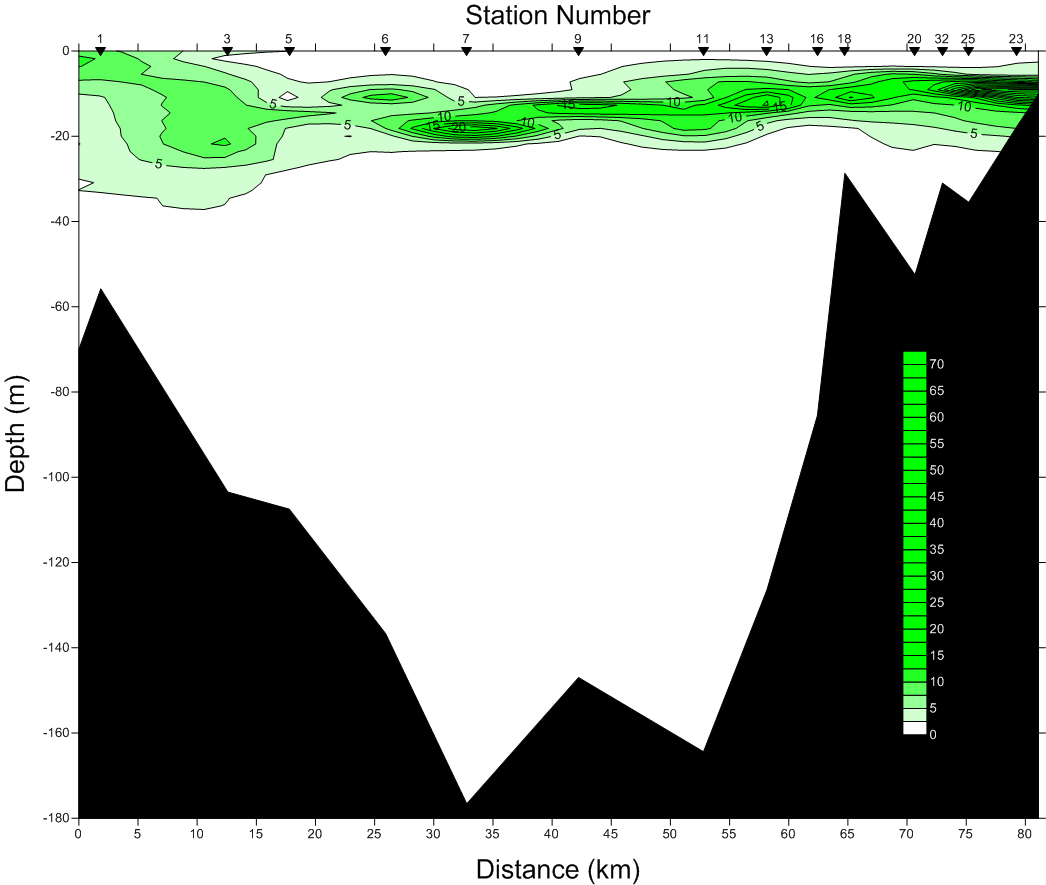
Fluorescence Profile (mg/m3
) |
|
This
transect plot shows the fluoresence
profile of the Hood Canal. Peaks in fluorescence concentration varied
from the
northern end of the canal to the southern end. Fluorescence peaked at
the
northern stations between 15 and 20m, whereas the peak in fluorescence
amongst
southern stations can be observed closer to 10m beneath the surface.
This data
suggests that nutrient availability and light penetration required by
photosynthetic organisms varies amongst the two ends of the canal. A
phytoplankton bloom is apparent just beneath the surface of the water
near the thermocline along the length of the basin. Phytoplankton are
highly concentrated at the southern end of the Hood Canal near Lynch
Cover (station 23).
|
CTD Fluorescence Concentration vs.
Discrete Chlorophyll a Concentrations
 |
|
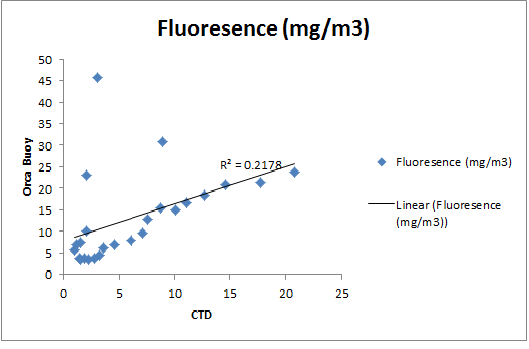
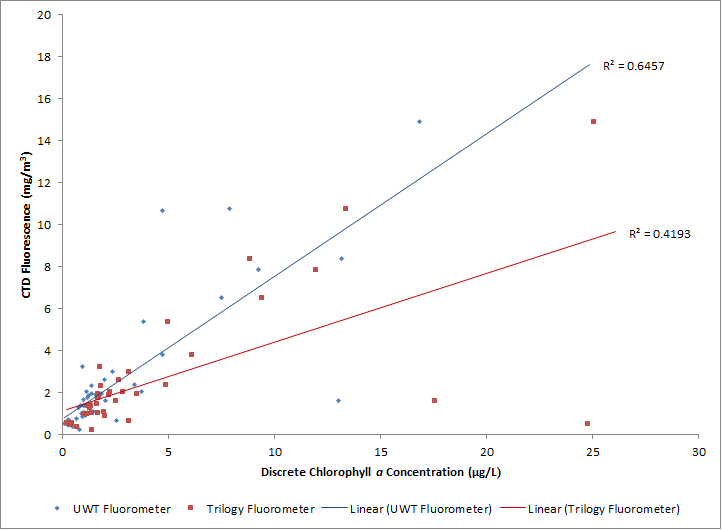
Chlorophyll a concentrations can be
compared to the CTD data to determine whether or not field or lab equipment is
functioning properly. Fluorescence and chlorophyll concentrations are
determined using different techniques that account for photosynthetic pigments
present in organisms in the water. The r2 value shows a large
variation between the two sampling methods, with a moderate correlation when
using both the UWT and Trilogy models of fluorometer. The trend line associated
with the UWT fluorometer accounts for 64.57% of the variance between the two
sampling methods. This value is higher than the cholorphyll data produced by
the Triology fluorometer which accounts for only 41.93% of the variance between
the two sampling methods. Due to the fact that the research team has had
issues with both fluorometers used to analyze discrete samples of chlorophyll a,
there is a large probability that the discrete samples did not produce reliable
data and that the CTD made more precise measurements. The Trilogy fluorometer
began malfunctioning while processing the samples from the northern leg of the
trip, and ultimately was not used to measure chlorophyll a concentrations
when standards were required between most samples.
|
Trilogy Fluorometer Data vs.
UWT Fluorometer Data
 |
|
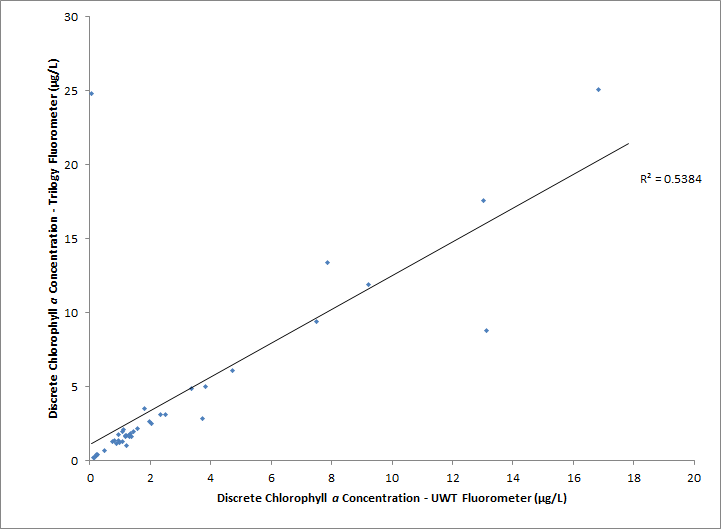
This figure compares the data produced by
both the UWT and Trilogy fluorometers to one another. The trend line accounts
for nearly 54% of the variance between the data from each fluorometer. This
moderate correlation suggest that the two fluorometers were not functioning the
same and suggests that one of the fluorometers, most likely the Trilogy model,
was malfunctioning.
|
Dissolved Oxygen Profile (mg/L)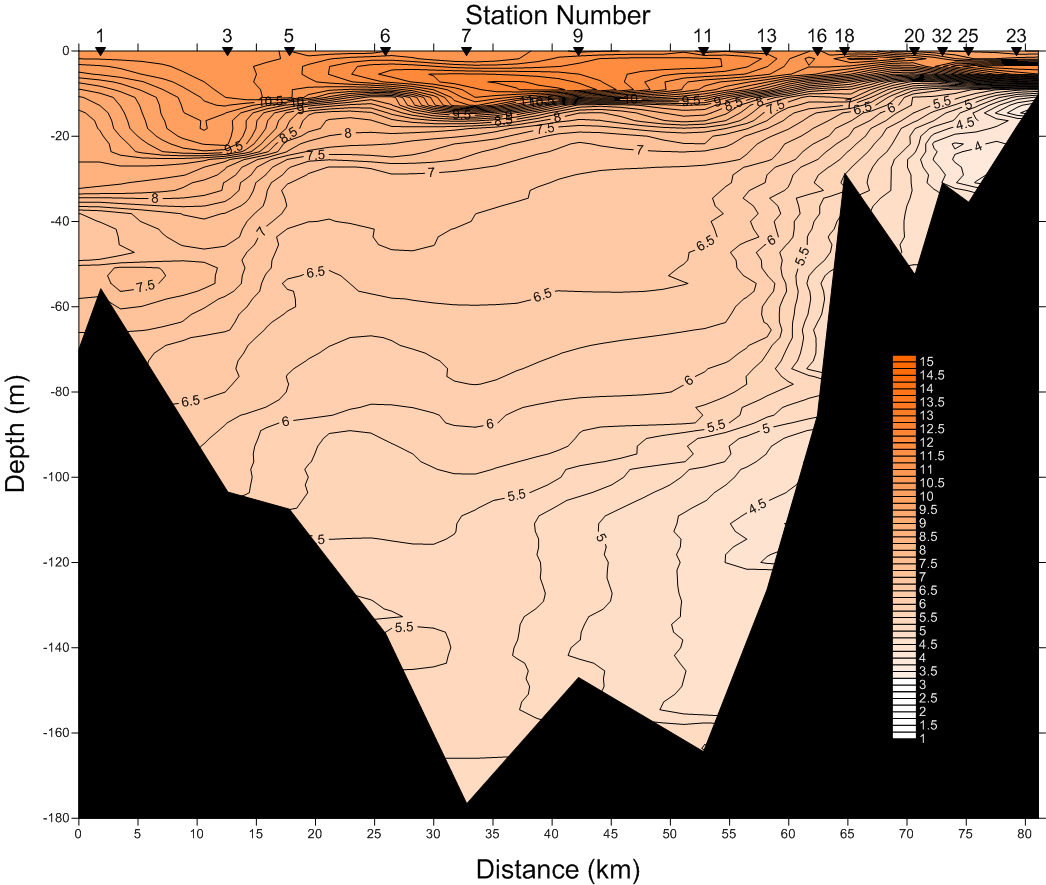 |
|
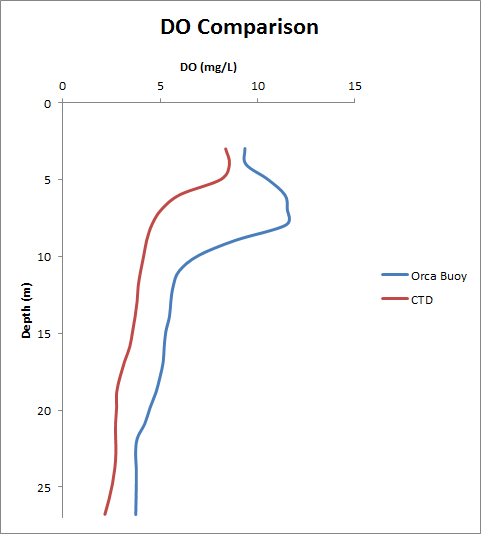
This transect plot displays the dissolved
oxygen profile of the Hood Canal. At all stations along the length of the Hood
Canal, dissolved oxygen concentrations increase beneath the surface before
rapidly decreasing with increasing depth. These low concentrations are a result
of insufficient outflow of water from the Hood Canal basin of the Puget Sound.
Due to the fact that water remains within this basin for extended periods of
time, highly oxygenated water near the surface interacts little with mixed
water lacking oxygen beneath it.
|
CTD Dissolved Oxygen Concentration vs.
Discrete Dissolved Oxygen Concentration
 |
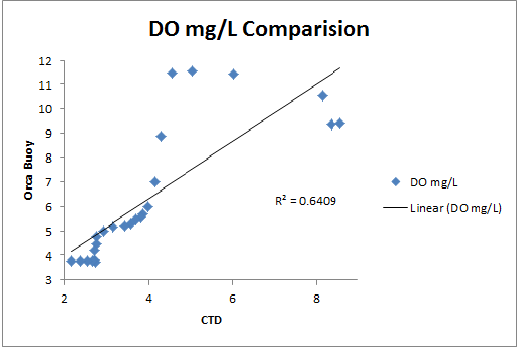
|
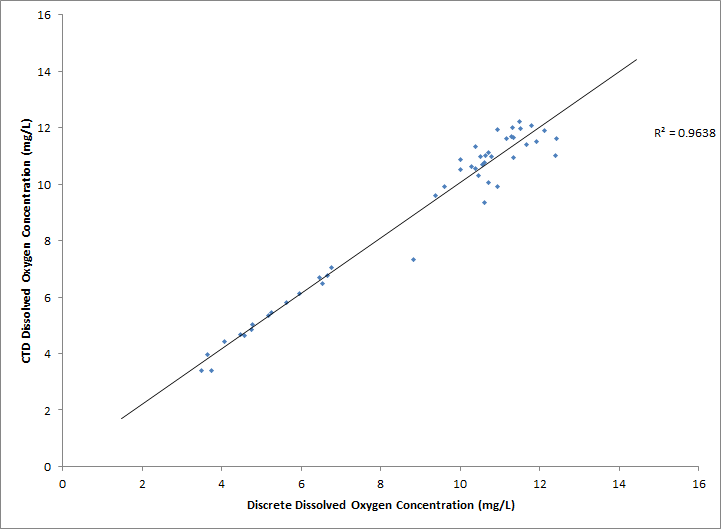
Water samples taken from the Niskin and
Thoreson bottles can be also compared to the CTD data to account for any
discrepancies in the data. Typically issues with the CTD, the laboratory
equipment, or discrete sample collection can be identified after comparing the
two sets of data. This graph represents the relationship between the dissolved
oxygen concentrations measured by the CTD and the discrete dissolved oxygen
concentrations obtained from bottle samples taken on the boat and fixed
immediately after sample collection. The r2 value provides the
amount of variance between the two sampling methods at any given depth and
location. The average of all discrete dissolved oxygen samples collects were
compared to the CTD reading for each depth and location sampled. With an r2
value of 0.9638, this trend line accounts for over 96% of the variance between
the two collection methods. This high correlation between the two sampling
methods suggest that not only was the CTD functioning properly, but discrete
water samples taken in the field were fixed correctly and ultimately titrated
properly (Winkler Method) in the lab to determine the dissolved oxygen concentrations within the
Hood Canal.
|
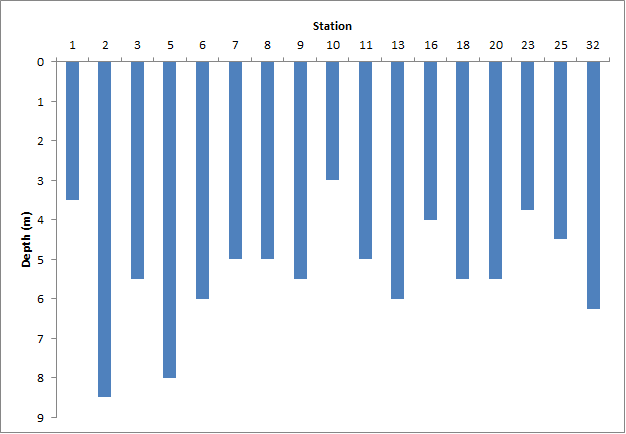
Secchi Disk Readings - Turbidity
 |
|
The
secchi disk was used at each station to visually determine the relative
turbidity of each station. Secchi readings ranged from 3m to 8.5m beneath the
surface of the water. Although turbidity varied from station to station, the
general trend shows light penetration highest within the northern stations of
the Hood Canal and lower levels of light penetration near the southern end of
the canal. Stations at the southern end of the canal are generally shallower,
suggesting that particles suspended within the water are stirred up from the
benthic zone by currents and tidal flows. Stations near the northern end of the
Hood Canal are much deeper and particles suspended in the water may be from
incoming saltwater as opposed to being the result of stirred up sediments from
the benthic zone. The fact that readings were taken on two separate days must
also be taken into account when considering differences in readings.
|
 |
|
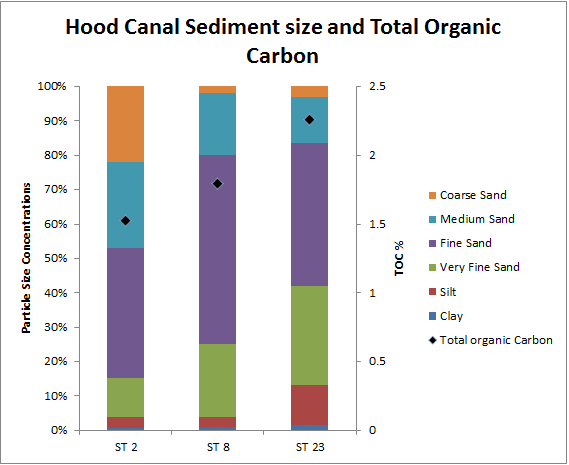
Sediment
samples from station 2
(northern), 8 (central), and 23 (southern) were collected and analyzed
to
determine sedimentary composition in the Hood Canal. All samples
were taken near the shore at shallow depths. The sediments were
measured, and the most abundant size was 250 micrometers.
Comparing the
most abundant size of the sediments to the Wentworth scale, it can be
concluded
that the sediment is between medium and fine sand along the length of
Hood
Canal. Total organic carbon was also measured within these
samples, and is between 1.5 and 2.5 percent. 1.5 to 2.5 percent total
carbon is fairly high. This is expected in the Hood Canal since the
flushing rate and mixing rate is low.
|
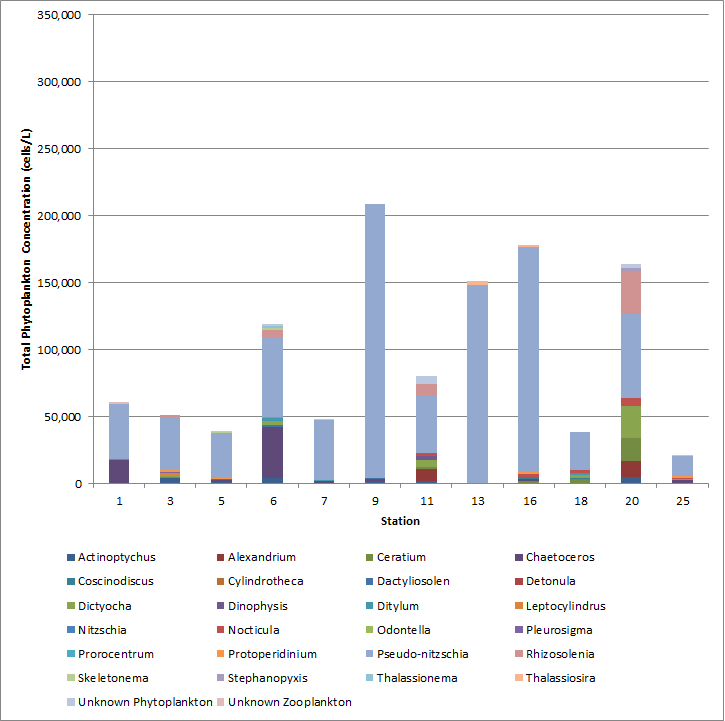
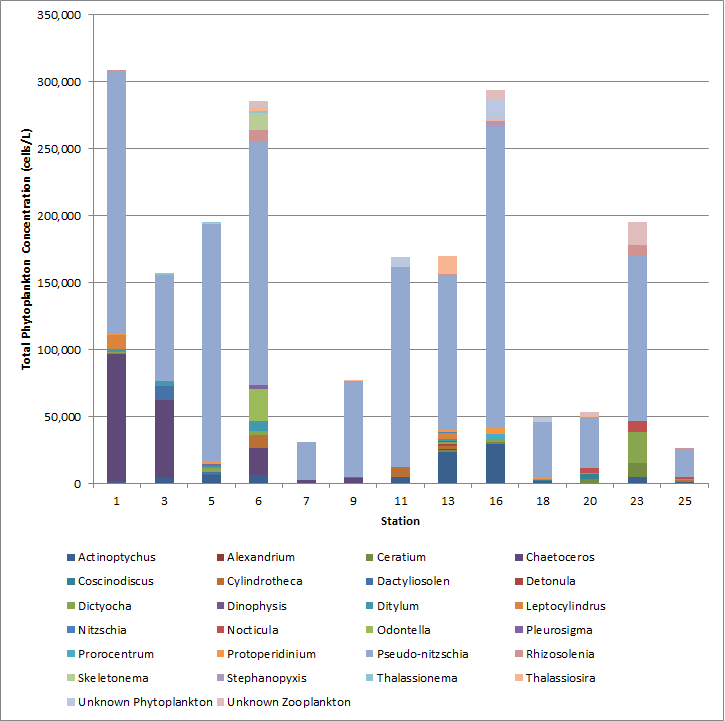
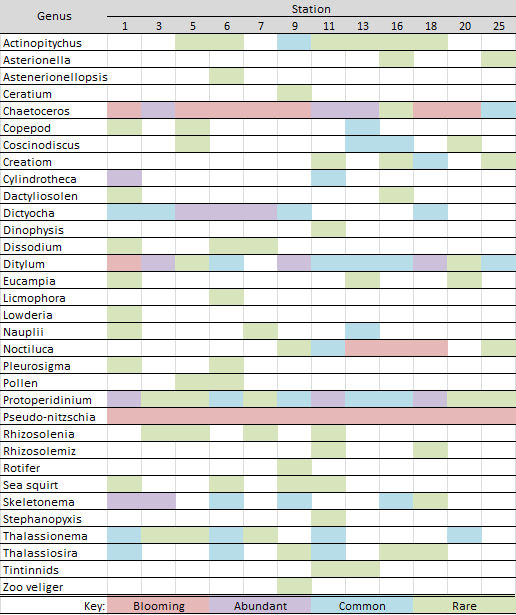
Phytoplankton Relative Abundances
 |