
Introduction to Geographic Information
Systems in Forest Resources |
Projections and Coordinate Systems
Objectives:
- Learn how to apply different map projections to data frames.
- Examine the distortions caused by various map projections.
- Learn how to project datasets from one projection/coordinate system to another.
- Perform drive
substitution to create drives L (CD) and M (removable drive).
- Open an existing map document
- Check map scale and coordinates
- Measure distances on an non-projected data frame
- Data Frame Projection (Temporary Display)
- Change the projection from Data Frame (Temporary Display)
- Project a shapefile (Permanent Change)
- Source data in decimal degrees
- Projected source data
- Close the project
Perform drive substitution
Perform drive
substitution to create the virtual drives L and M.
Open an existing map package
- Download
the map package Projection_Exer.
- Open the Projection_Exer map package. You should see a data frame of the world in a perspective as if
you were in space.
Check map scale and coordinates
The current map scale will be displayed at the right hand side of the tool
bar. Due to the monitor and resolution this example was developed on, the displayed
scale is 1:145,534,295 (scale depends on your viewer, if you zoom in, the scale
will be changed according to the viewer size). This means that 1 unit on the
map is equal to 145,534,295 units measured on the earth's surface. Your scale
representative fraction may differ from this, depending on your monitor's resolution.
To the right of the scale declaration is a display of the coordinate where
the pointer is located. As you move the pointer around the map data frame, you
will see the coordinates change. The coordinates are reported in map units,
which in this case, are miles. Because the data frame is centered on Seattle,
the coordinate values tell you how far away you are from Seattle (negative values
will show that the pointer is located to the south and/or west of Seattle).
This data frame is an Orthographic
Projection of underlying data which are stored in decimal degrees.
Measure distances on an non-projected data frame
- Collapse (click the "+" to the left of) the World from Space
data frame and activate (Right click World Map data frame and click on Activate) the World Map data frame.
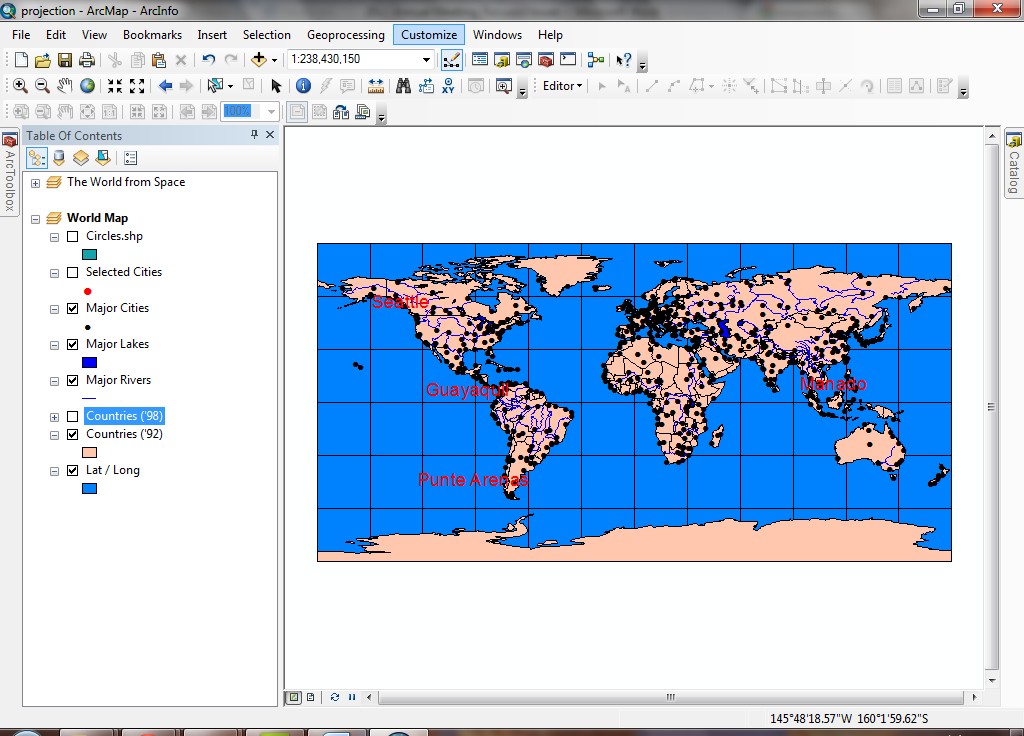
This data frame is unprojected (or Unknown), meaning that
the data are stored as geographic coordinates (also know as latitude-longitude,
or simply, lat-long). These coordinates are measurements of angles
on a sphere, rather than Cartesian coordinates measured on a plane. Although
the display is planar (displayed similar in appearance to the Plate Carée
projection), the underlying data are stored and accessed as decimal degrees.
- As you move the pointer, you will see coordinates change at the lower right
of the application window (reported in decimal degrees, with the Greenwich
Meridian is the origin of the X axis and the Equator is the origin of the
Y axis).
- Before measuring any distances or calculating scale, ArcGIS must be configured
to report measurements in units of the user's choice. This also means that
ArcGIS must be told what units the data are stored in. The reason for needing
to set both map (storage) and distance (display) units is that ArcGIS must
calculate a storage-unit to display-unit transformation. Without knowing what
the storage units are, it is impossible to calculate scale or to perform any
measurements. For this reason alone, you should always know the
projection and coordinate system of any datasets you are using.
- Right-click the World Map title in the table of contents and Select
Properties from the popup menu. Select the Coordinate System
tab. Select the coordinate system Predefined > Geographic Coordinate
Systems > World WGS 1984. This sets the projection for the data frame.
- In the General tab, set Display Units as Miles. We
want our measurements to be reported in miles. OK the change.
Now you will see that the scale declaration contains a value, and when you
move the pointer, the coordinates show the units are miles (at the bottom
of the window).
- Now measure some distances between selected cities. Turn on the Selected
Cities layer. You will see Seattle, Guayaquil, and Manado shown in red dots, with their names on the map.
- Maximize the size of the application window so your measurements will be
more precise.
- Click the Measure tool
 .
.
- Select the Miles as the distance unit in the measurement tool dialog.
- Move the pointer over Seattle, and click the mouse button.
This starts a line segment. Notice the status bar in the measurement window reports the
distance of the current segment as well as the total length of the line.
- Move the pointer over Guayaquil, and double-click
the mouse. You should get a distance of approximately 4,300 miles.
- Now measure the distance between Guayaquil and Manado.
This distance should measure approximately 10,700 miles.
You have just made some simple measurements on a data frame. Because of the
scale at which we are viewing the data, these measurements are approximate,
and will differ if you repeat the measurements. For more precise measurements
we will use different tools covered later in the course.
It is especially important to remember that you need to set data frame properties
for projection and display units before you can view map scale, or perform any
measurements. You must know the units in which your data are stored!
Apply a projection to the data frame
Projections always distort map properties. We will see how a different
projection distorts distance.
Reminder: Change the Projection in the data frame will only change the display temporarily but applied to every layer within this data frame.
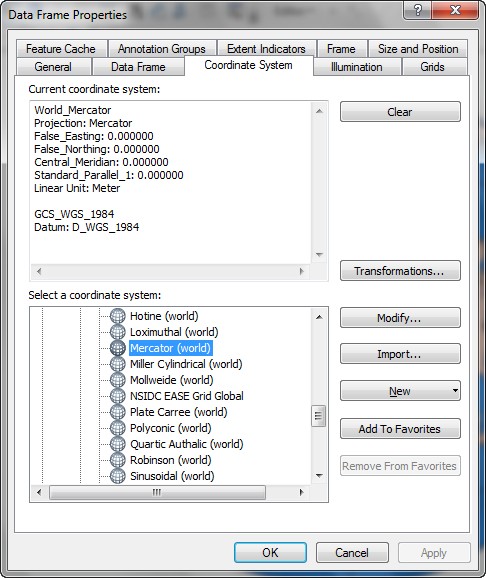
- Open the data frame properties again, and in the Coordinate System
tab, select Predefined > Projected Coordinate Systems > World
> Mercator (world) from the Type dropdown. Also make sure display
units are set to Miles in the General tab.
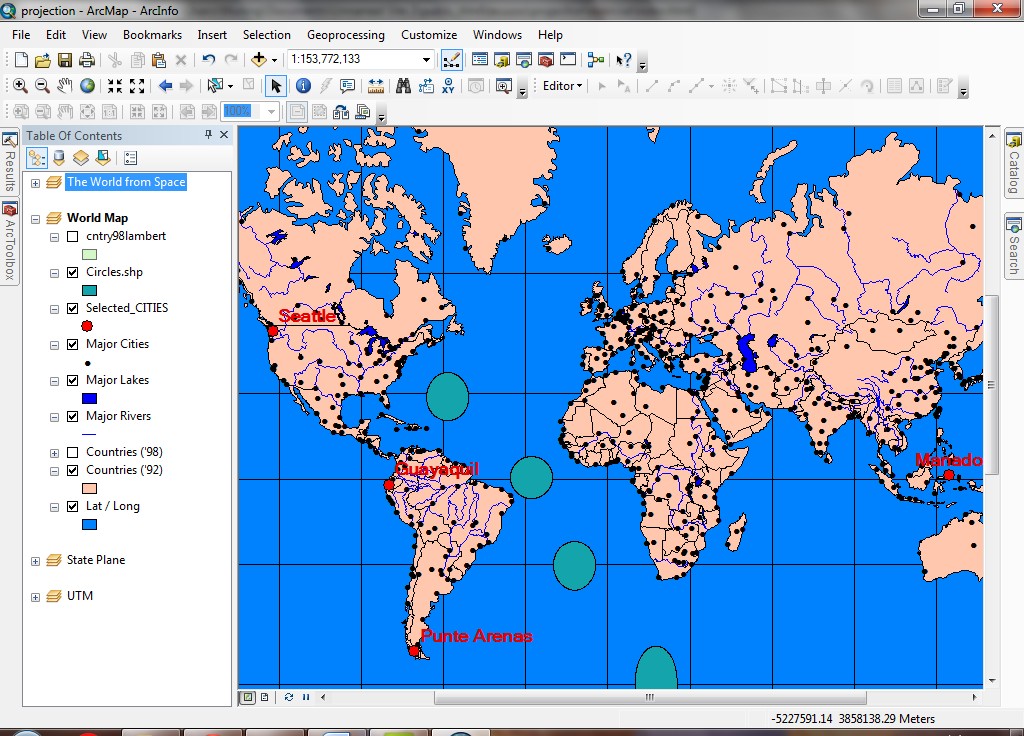
- Right-click the Selected Cities layer active select Zoom to layer.
- Notice how different the map looks. The area near the equator is stretched
out to the north, and the northern latitudes are compressed. The Mercator
projection was developed to give correct compass bearings between locations
for seafaring.

- Make the same measurements as you did before. This time you should get distances
of about 4,800 and 14,200 miles, respectively. Because projections distort
measurements, it is important to know what projection to use in order to make
decisions.
In the Mercator projection, in the Y direction, distances are stretched increasingly
near the poles. This is the reason we get distorted Y measurements. The projection
is not distorted in the X direction along the equator (since this is a secant
of the projection, known as a standard parallel). But because Guayaquil and
Manado are not exactly on the equator, there is a slight distortion due to
Y-stretching.
You have just seen the effect that projection can have on linear measurements.
When you need to make large distance measurements on a map of the world, use
unprojected data in an unprojected data frame. The measurements will be calculated
on great circles, which will be more accurate than measurements made on a projected
data frame, unless you have data projected specifically for minimizing distance
distortion. The properties of the projection can have a profound effect on the
measurements you make. When distances are calculated by different analytical
processes within ArcGIS, the results will be distorted according to the projection
you have used.
Change the projection
You have just seen how a difference in projection can change distance measurements.
Now see how projections can also distort shape and area.
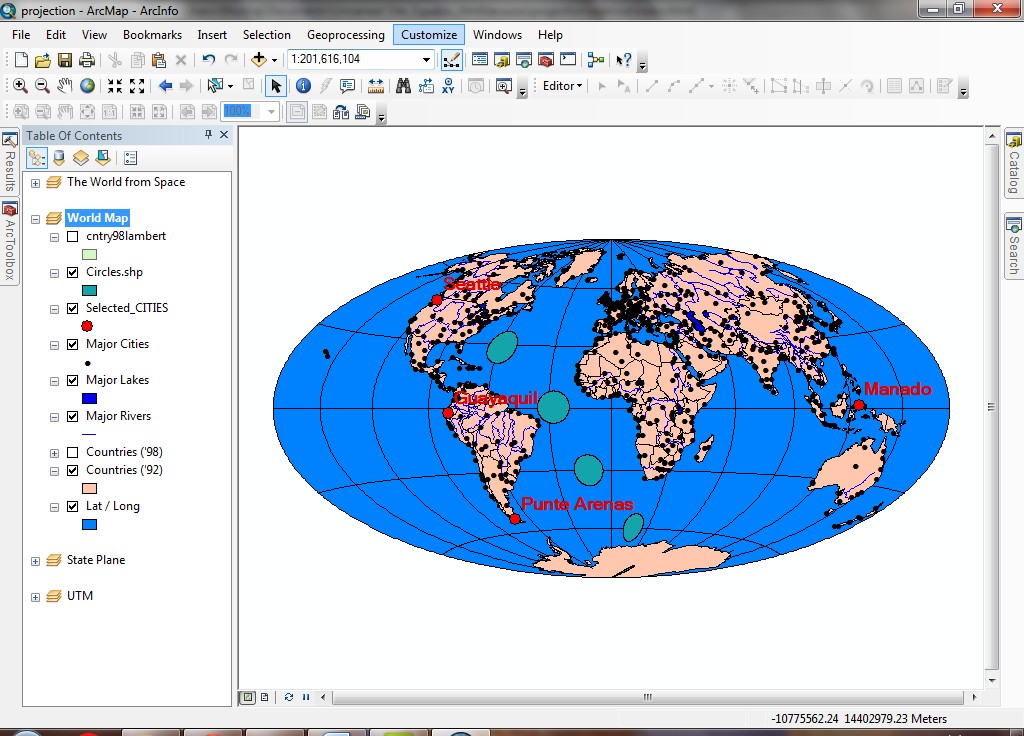
- Turn on the Circles.shp layer.
Notice how the circles are distorted toward the poles.
- Turn off the Selected Cities layer.
- Change the projection now to Hammer-Aitoff projection: Predefined > Projected Coordinate Systems > World
>Hammer-Aitoff.
- Finally, change the projection back to WGS 1984.
- Feel free to experiment with different projections, and see how they distort
the shapes and areas of features. Make some measurements of area on data frames
with different projections using any of the polygon drawing tools to see the
effect of projections on area measurements.
You have just seen the effect that projection can have on shape and area. Again,
if you need accurate area measurements, make sure to choose a projection that
correctly represents area. See the reference
pages on projections for details on the properties of different projections,
or look in ArcGIS documentation. When areas are calculated by different analytical
processes within ArcGIS, the results will be distorted according to the projection
you have used.
Project a shapefile (Permanent Change)
As to no predefined projection layer, you will need to assign the projection to it by using "define projection" tools.
As to the projection change from one projection to another, use the "project" tool to make the permanent change.
You may frequently have datasets representing the same location that are already
stored in different projections and coordinate systems. At ArcGIS, there is
a Projection Engine that allows you to convert datasets from one projection
to another. In this exercise, you will project one dataset to match another.
NOTE: the ArcGIS projection engine may be slow. When you are projecting datasets,
you will need to be patient, especially if you are on a slow computer. A way
to increase the speed is to turn off any anti-virus software during the use
of the extension.
- Download the file projection_files.zip
(Pack Forest data stored in 6 different projections) into M:\projection\.
- Open a Windows Explorer and navigate to M:\projection\. If you are familiar with unzipping files, unzip the zip file.
- Double-click on the zip file.
- Click "Extract all files" at the left-hand side of the window above.
- Click "Finish." The file stucture should be as shown below.
This will extract the components of the 6 shapefiles needed for the exercise, roads_utm27, roads_sps83, stands_utm83, and stands_sps27.
The files will be placed in separate directories (utm and state_plane)
on your removable drive.
Here are the projection parameters for each dataset:
| name |
data |
projection |
zone |
datum |
units |
| soils_spn27 |
forest soils |
State Plane |
WA-North |
NAD27 |
feet |
| nwi_spn83 |
National Wetland Inventory |
State Plane |
WA-North |
NAD83 |
feet |
| streams_sps83 |
streams |
State Plane |
WA-South |
NAD83 |
feet |
| pls_sec_sps27 |
PLSS sections |
State Plane |
WA-South |
NAD27 |
feet |
| roads_utm27 |
roads |
UTM |
10 |
NAD27 |
meters |
| soils_utm83 |
soils |
UTM |
10 |
NAD83 |
meters |
- Collapse the World Map data frame, and insert a new data frame (Insert
> Data Frame), and alter its title to State Plane.
- Add all 4 of the State Plane datasets (from the State Plane folder)
from the file you downloaded and extracted. If you get an error message, click
OK. This is because none of the shapefiles have projection information
stored with them.
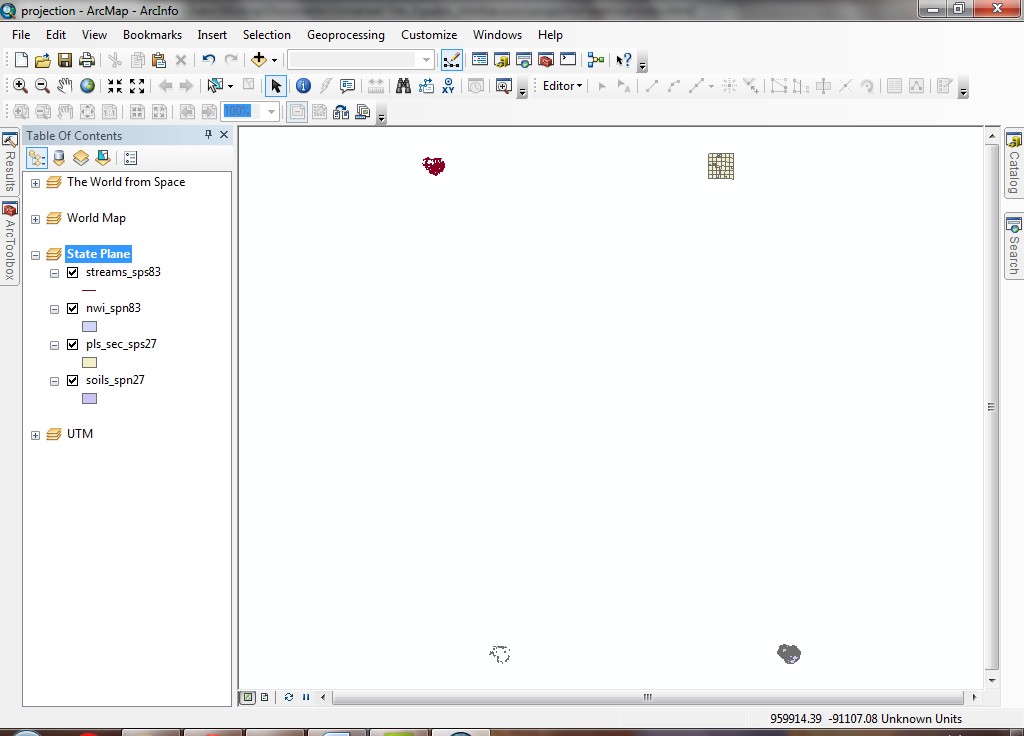
Even though these datasets represent features at the same real-world location,
the projections they are stored in differ, which is why they do not overlap
as expected. Although all 4 of these are stored in the State Plane system,
they differ in both the State Plane zone and the datum in which they are stored
. These differences are what cause the layers not to line up with each other.
- Create another data frame (call this one UTM) and add both shapefiles
from the UTM folder to the data frame.
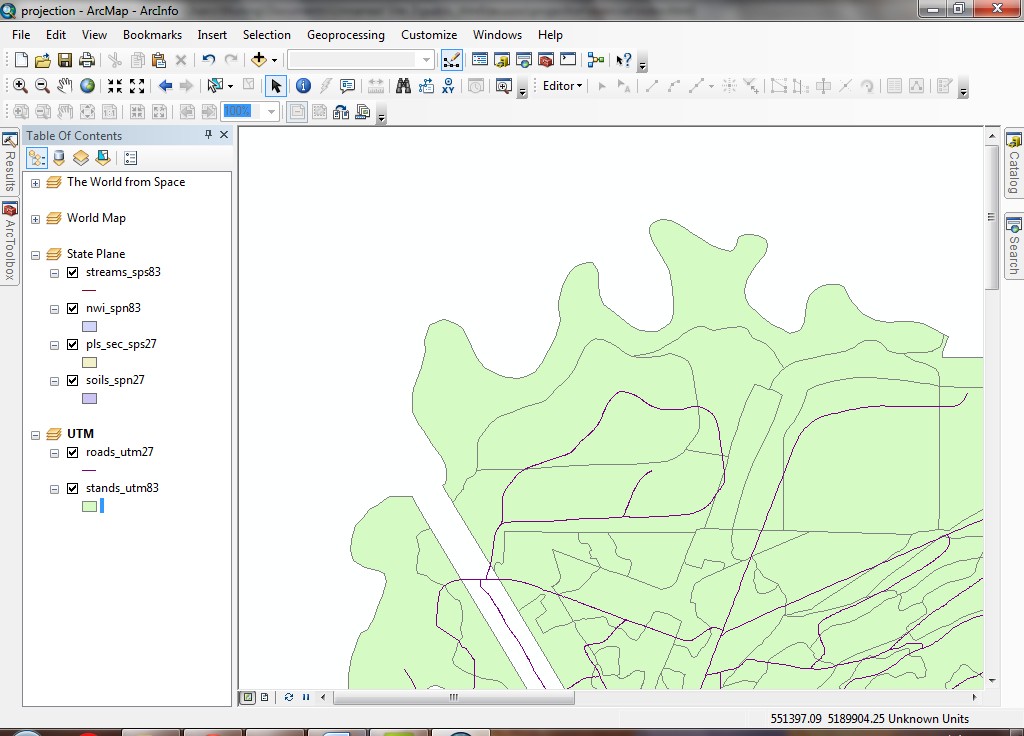
If you zoom in and pan around, you will see clearly where the layers do not
line up where they should.
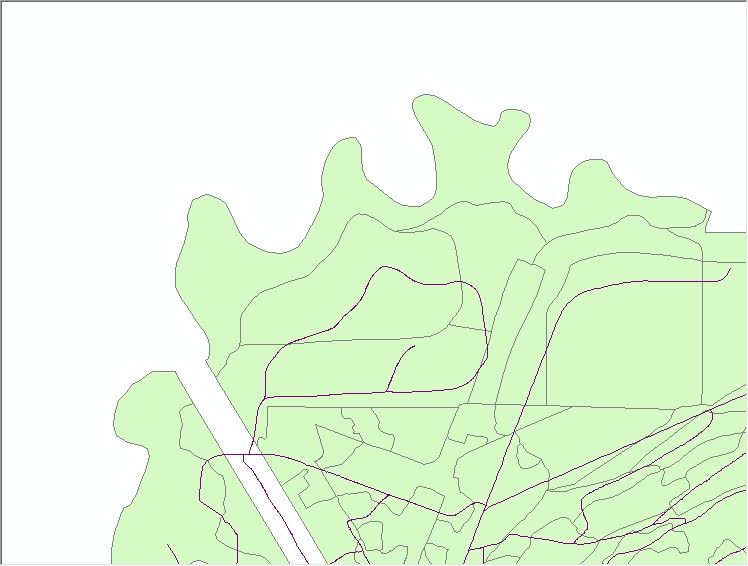
The difference between NAD27 and NAD83 is less profound when using the UTM
system than when using State Plane for Washington State, but you should still
be able to see how the features do not line up as expected.
We will project the roads dataset so it will overlay the stands correctly.
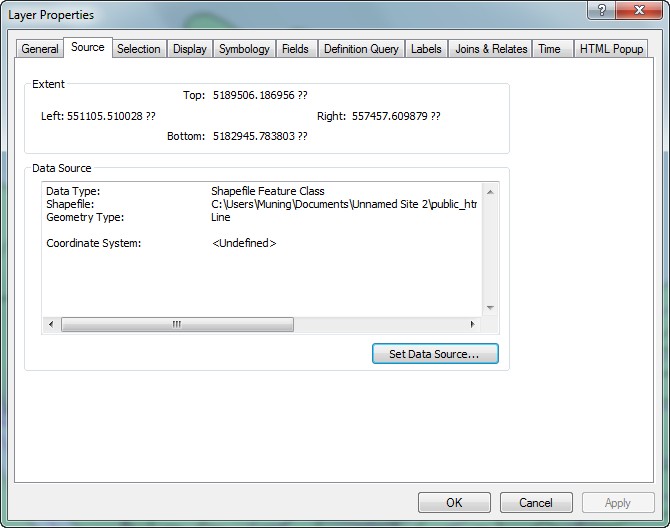
- To understand which projection tool to use, right click the layer to see if there is any projection has been assigned into either layer. For this inspection, right-click roads_utm27 layer, select propertities, check the Source tab. You will see <Undefined> were written in the Coordinate System, which means there is no projection has been assigned to this layer yet.
- Because neither of these datasets have projections defined, the first step
will be to define the projection on each of them. Note that "defining"
the projection on a dataset does not alter the dataset in any fundamental
way, it just makes a record of what projection the dataset is stored in. However,
in order for ArcGIS to project a dataset from one system to another, it must
know what the input projection system is. This step, defining the projection,
accomplishes the task of letting ArcGIS know about the dataset's current storage
parameters. It is absolutely essential that you define a dataset's projection
properly. If you make a mistake in defining the projection, errors will ensue
any time you use the dataset.
-
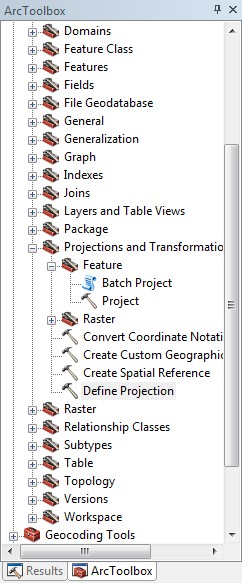
Open ArcToolbox. You may want to "dock" it in your application
window. After that, select Data Management Tools > Projections and Transformations
and double-click the Define Projection tool.
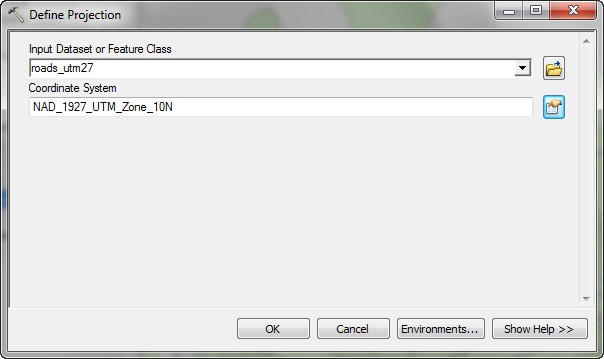
- Select roads_utm27 as the Input Dataset
.
- Click the button to select a coordinate system
 .
.
- Click Select. Select Projected Coordinate Systems > UTM
> NAD 1927 > NAD 1927 UTM Zone 10N.prj. A progress window will
display. When the process is complete, Close the dialog.
- Don't skip this step! Do the same
for the stands_utm83 layer, but select the projection Projected
Coordinate Systems > UTM > NAD 1983 > NAD 1983 UTM Zone 10N.prj

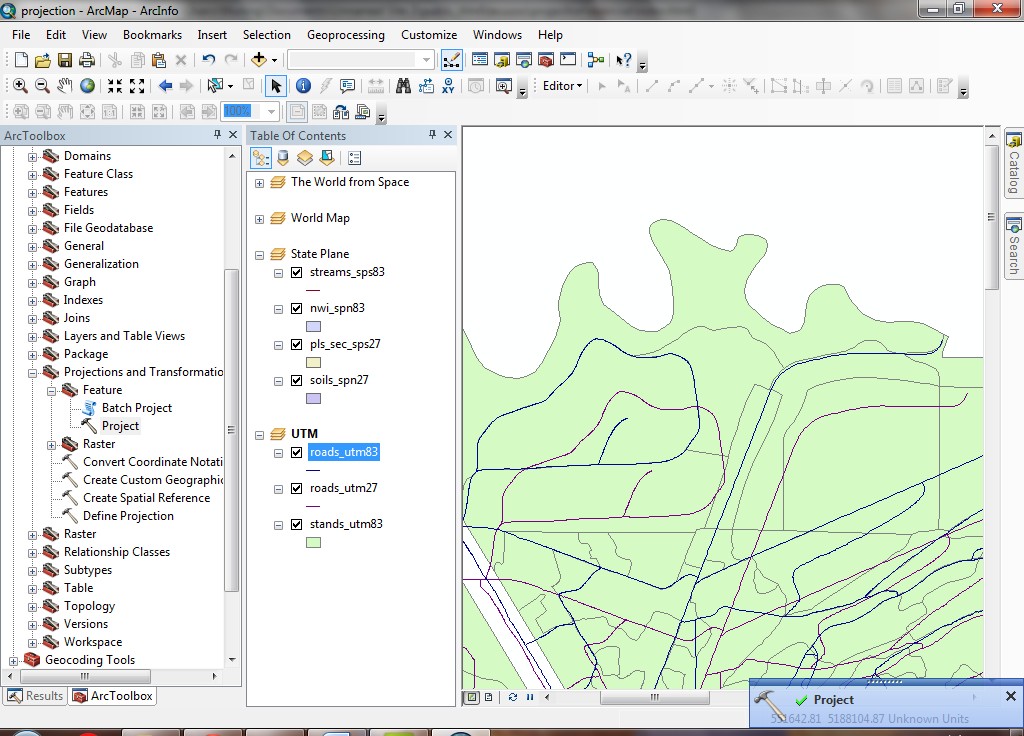
- After the road layer has been defined as UTM 1927, there is a fact that road layer and stand layer are not the same projection. When there is a different projection among one to the other, we need to switch road projection again to match the stand projection.
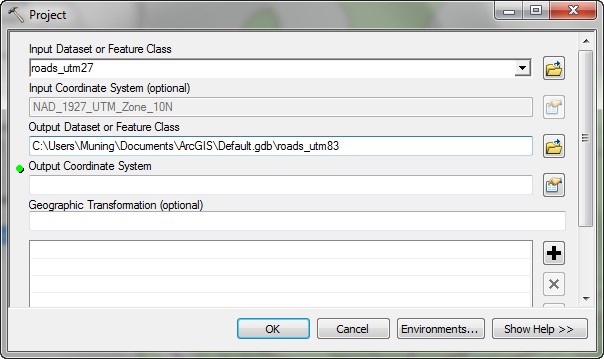
- From ArcToolbox, now select the tool Data Management Tools > Projections
and Transformations > Feature > Project.
- Select roads_utm27 as the Input Dataset. For the Output
Dataset, specify that you will be saving the dataset as roads_utm83.
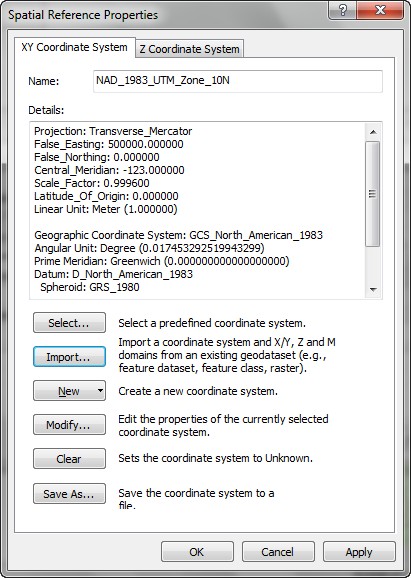
- For the Output Coordinate System, click the button to select
a coordinate system .
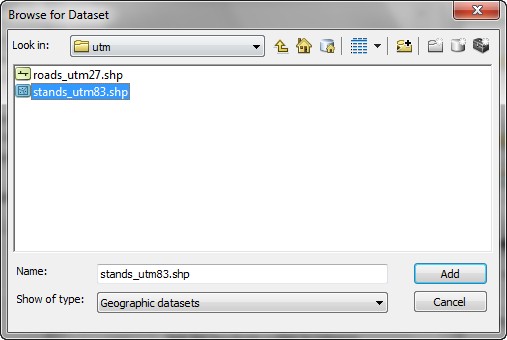
Click Import, which will allow you to copy the coordinate system
from an existing data source. Navigate to the dataset for stands_utm83.
- For the Geographic Transformation, select NAD_1927_To_NAD_1983_NADCON.
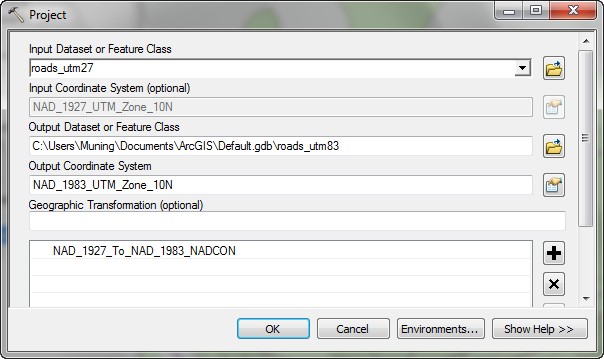
- Click OK. A progress dialog will indicate when the process is complete.
Click Close.
- The new dataset is added as a layer to the map (if it is not added, please add it). Turn off the roads_utm27
layer and turn on the new roads_utm83 layer. You will see that it now
overlaps with the stands properly.
Close the map document
- Save the map document as projection.mxd on your removable drive.
Projections and coordinate systems may seem complex and arcane to you, but
as you become more familiar with GIS and GIS datasets, you will become more
capable of handling different coordinate systems and projections.
REMEMBER TO TAKE YOUR CD AND REMOVABLE DRIVE
WITH YOU!!!!
Return to top
 |
|
The University of Washington Spatial Technology, GIS, and Remote Sensing
Page is supported by the School
of Forest Resources
|
|
School of Forest Resources
|
 UW
Home
UW
Home