| Home |
| About Us |
| Methods |
| Sample Sites
|
| Data Repository |
| Acknowledgements |
Hood Canal |
Results and Discussion: This collection of data provides a historical background for subsequent UW research students that will be sampling this area in the future. The master log, CTD data, and nutrient data from the Hood Canal can be accessed by linking to the data repository located at the main option bar. This section discusses results from the CTD profile, Niskin bottle sample analysis, secchi depth, plankton and grain size analysis.
Map of Hood Canal sample stations. Click to enlarge. |

Comparison of Data


Click each graph to enlarge.
These graphs show a comparison of data collected by the CTD and the data collected by running the samples in the lab. The R value on each graph shows the relative accuracy of the data results (CTD and lab) when compared to each other.
CTD Profiles
Temperature Profile
Click to enlarge.
Surfer plot showing the temperatures found in all thirteen stations. The plot shows in the (Y) axis the depth in meters and in the (X) axis the temperature in Degrees Celsius.
Temperature has a strong thermocline at 10 meters depth with warmer water at the shallower stations of 16 to 23 in the Hook of Hood Canal. There is more temperature change at the surface and little to no temperature change with depth.
Salinity Profile

Click to enlarge.
Surfer plot showing the salinity levels found in all thirteen stations. The plot shows in the (Y) axis the depth in meters and in the (X) axis the concentration of salt in SPU.
Salinity values are increasing with depth however there is not a significant difference in density from stations 1 to 13. Salinity profiles indicate that there is a strong halocline between the surface and 10 meters depth. At the hook of Hood Canal, stations 16 to 23 there are lower salinity values at the surface that are most likely due to a freshwater intrusion.
Density Profile

Click to enlarge.
Surfer plot showing the density levels found in all thirteen stations. The plot shows in the (Y) axis the depth in meters and in the (X) axis the Density concentration in milligrams per liter.
Density values are also increasing with depth however there is not a significant change in density from stations 1 to 13. However, the most change in density is observed from stations 16 to 23. This indicates that there is a strong pycnocline between the surface and 10 meters depth. This corresponds to the salinity profile; therefore the salinity is determining the density of the water rather than the temperature. This is to be expected for an estuary.
Dissolved Oxygen

Click to enlarge.
Surfer plot showing the Dissolved Oxygen found in all thirteen stations. The plot shows in the (Y) axis the depth in meters and in the (X) axis the dissolved oxygen in milligrams per liter.
Dissolved oxygen profile is strongly stratified and becomes more stratified from north to south. Hypoxic conditions (<4ml/l) start at station 13 at a depth of 20 meters and below. Between stations 13 and 23 the dissolved oxygen concentration continues to decrease till hypoxic conditions at station 23 are at 5 meters depth and below. There is a strong thermocline at 10 meters depth at stations 20 to 23 at the shallow hook of the Hood Canal with higher DO above the thermocline and the lowest DO value below at station 23. Highest dissolved oxygen concentrations are at stations 1 to 11 from the surface to 10 meters depth.
Fluorescence Profile

Click to enlarge.
Surfer plot showing the Fluorescence level found in all thirteen stations. The plot shows in the (y) axis the depth in meters and in the (X) axis the Fluorescence in milliliters per liter.
Significantly high fluorescence values are located around the thermocline at 10 meters depth. There are two pockets of high concentration, one located at station 1, the sill and the smaller one at station 7 in the middle of the channel. The last pocket is located at stations 20 to 25 and does not have as high intensity of fluorescence as the other pockets.
Transmissivity Profile

Click to enlarge.
Surfer plot showing the Transmissivity level found in all thirteen stations. The plot shows in the (y) axis the depth in meters and in the (X) axis.
Transmissivity has clearer water near the surface and at the middle stations. The water below 20 meters is consistently opaque.
Discussion
Fluorescence values are significantly higher in three pockets located at stations 1, 7 and 23 at 10 meters depth. The high dissolved oxygen values at these stations is most likely due to high productivity at these same locations. Station 23 has severely low dissolved oxygen conditions below the thermocline. However, there is higher dissolved oxygen above the thermocline. This is most likely due to high productivity at this station as well.
Secchi Graph Data
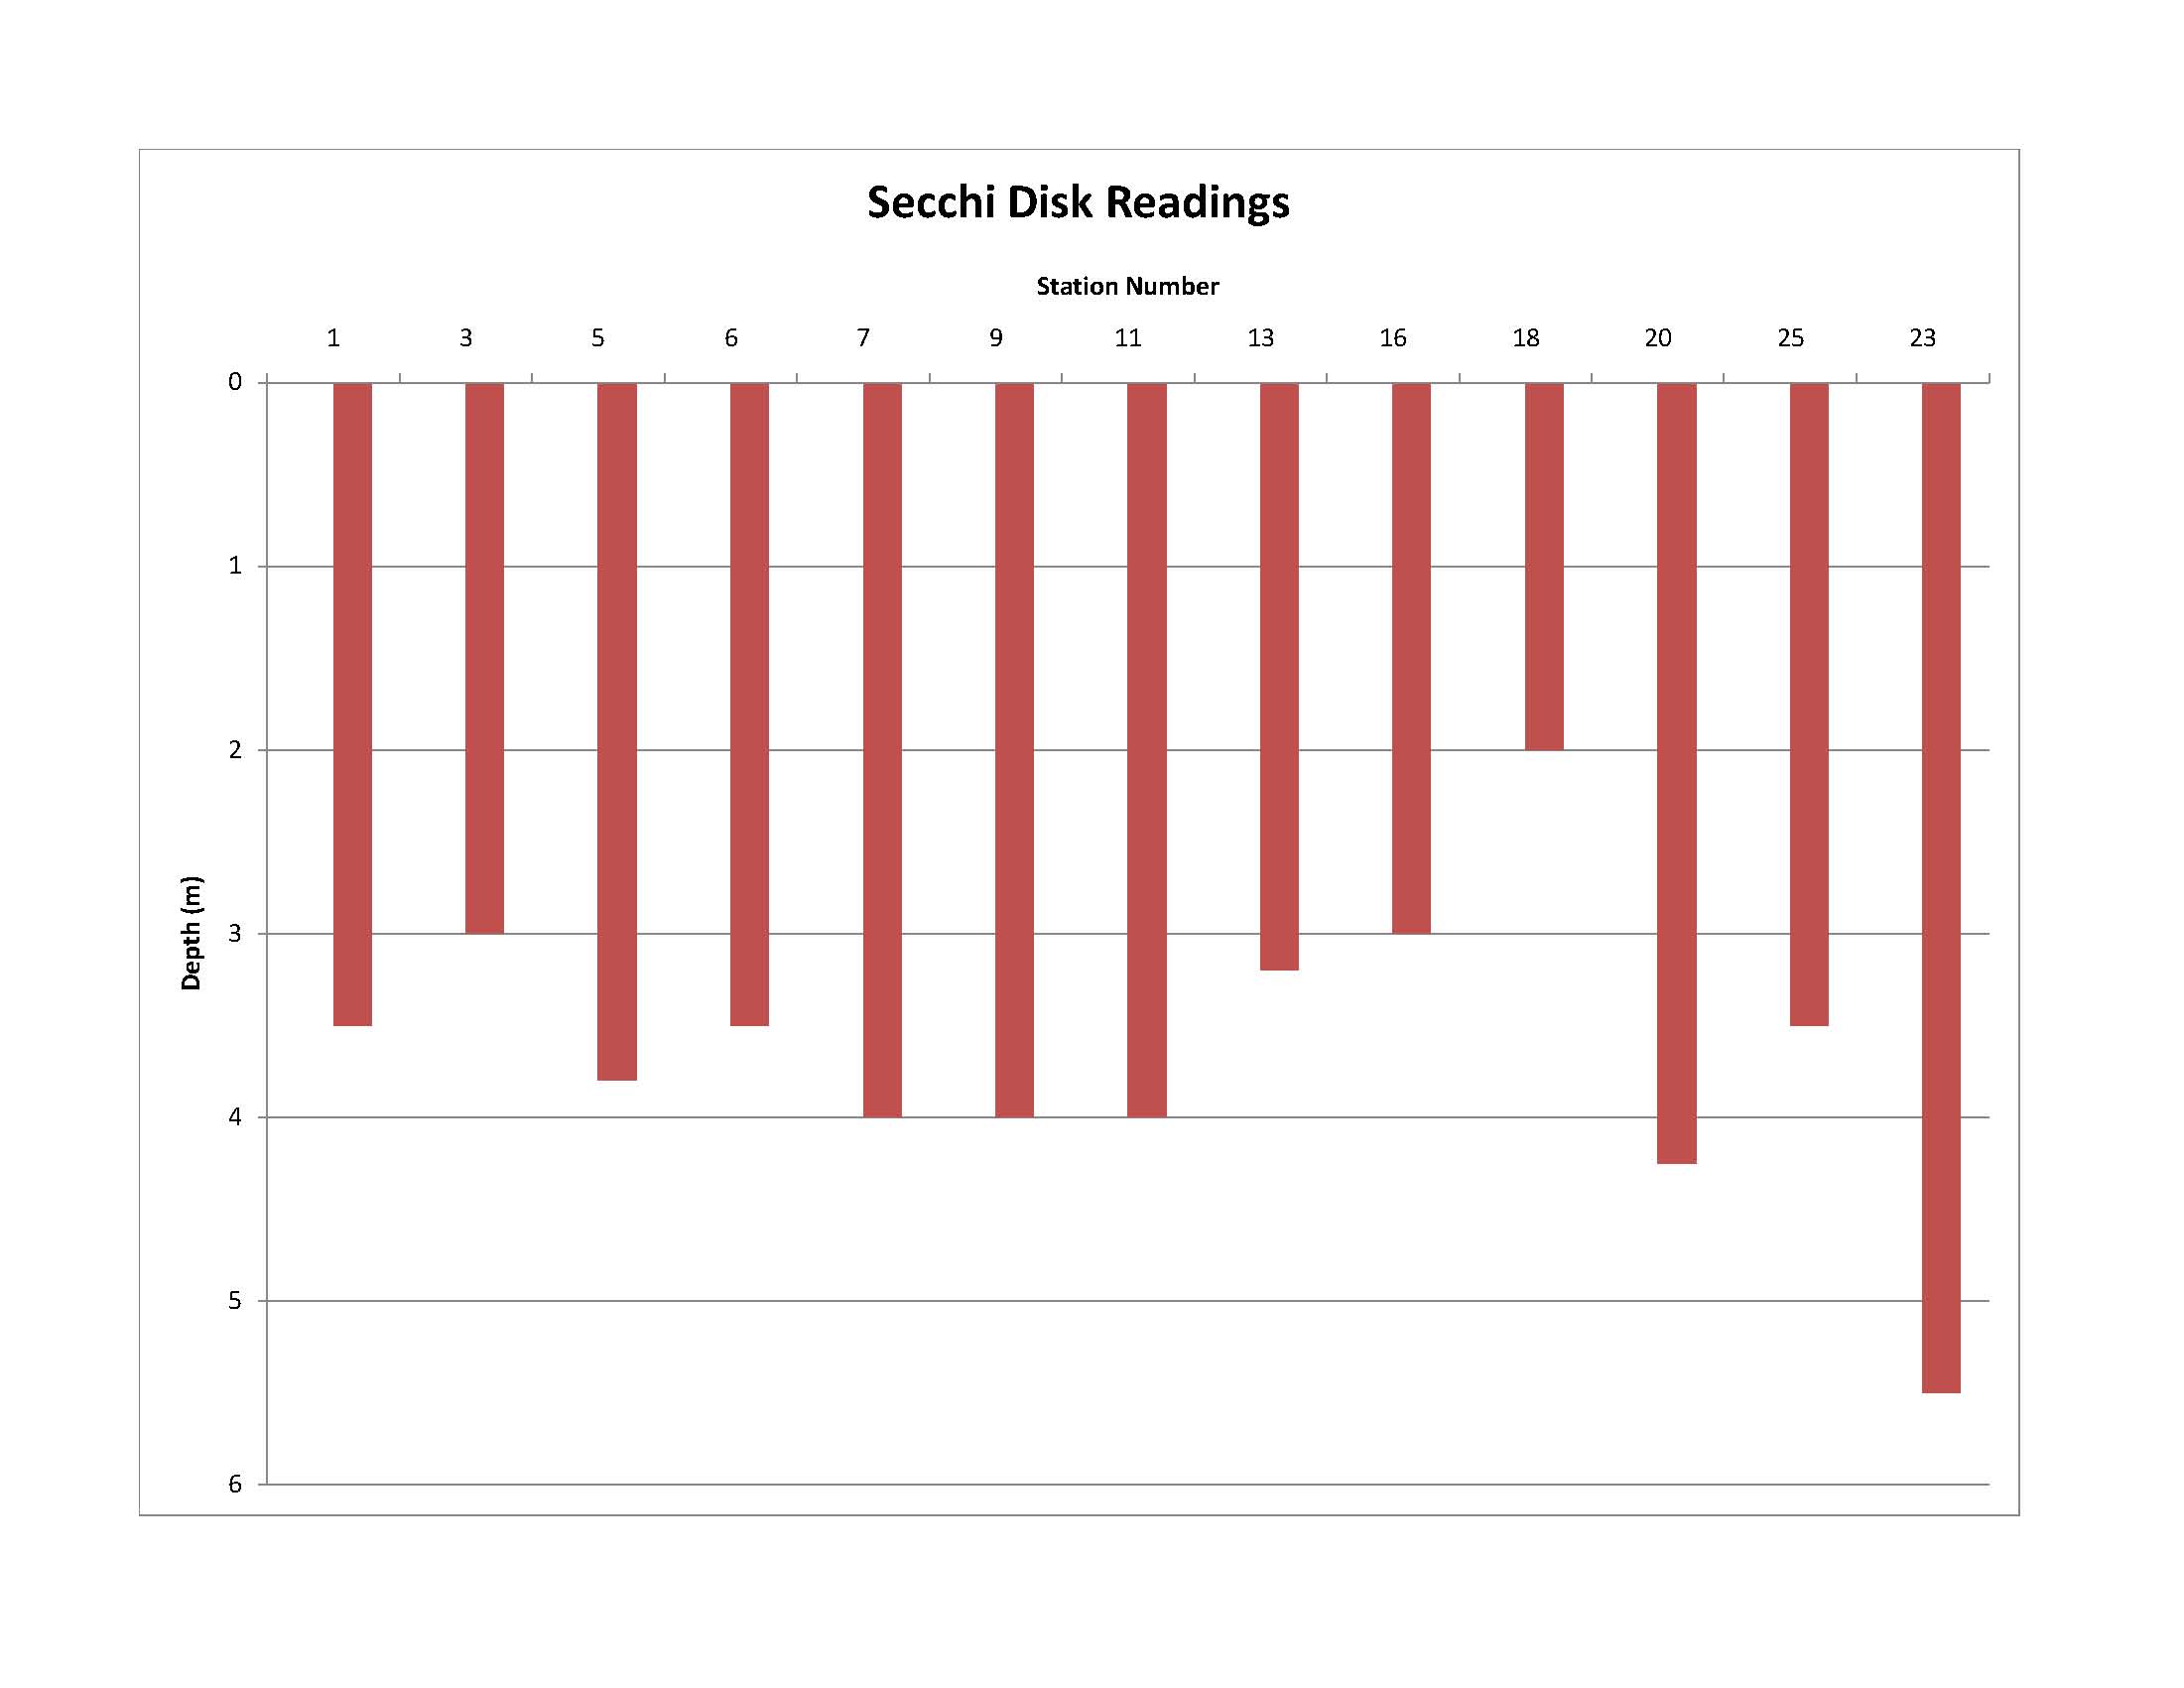
Click to enlarge.
The secchi readings in Hood Canal indicate that the water is more clear moving south towards the center (station 11) of the canal, and then it becomes more murky and cloudy around Big Bend, and clear again at the last station (station 23.) The reason for the change in water clarity can be attributed to the freshwater input from rain showers a few days prior to testing. Compared to data collected in Spring 2005 Estuarine Field Study Class, our secchi readings are lower, indicating that the water at this sampling time was murkier than previous sampling events.
Phytoplankton


Click to enlarge.
Phytoplankton Graph and Net Sample Chart.
In Hood Canal three types of plankton were found at every sampling station, Chaetoceros, Thalassionema, and the Eucampia. Each site had a variety of phytoplankton (see chart right). Phytoplankton collection and identification is important because it is an indicator of biodiversity.
Sediment Data (particle size)
Particle Size Station 1

Click to enlarge.
Particle sizes at Station 1 show that the data is left skewed, indicating there is a lower percentage (under 10%) of sediment within the range of .4 and 31 micrometers. This particle size is clay sized. At Station 1 approximately 40% of the particles fell within the range of 31 to 125 micrometers. This particle size is mostly very fine sand.
Particle Size Station 2

Click to enlarge.
Particle sizes at Station 2 show that the data is left skewed, indicating there is a lower percentage (between 8% and 11%) of sediment within the range of .4 and 31 micrometers. This particle size is clay sized. At Station 2 between 11% and 25% of the particles fell within the range of 31 to 125 micrometers. This particle size is mostly very fine sand.
Total Organic Compounds (Stations 1,2,4)

Click to enlarge.
Station 1 has the highest TOC from our analyzed samples. Station 1 is located at the sill of Hood Canal. Stations 2 and 4 are south of Station 1 and are closer to the shore. Station 1 is a deep station that allows material to settle. Stations 2 and 4 are more likely to be mixed resulting in lower TOC.