TAPESTRY: The Art of Representation and Abstraction
Hidden Lines and Surfaces: Linear Interpolation
What's it all about?
If I know two pieces of information (e.g. the temperature at 10:00 am and noon) it is sometimes useful to derive a means of guessing intermediate values (the temperature at 11:00 am). This general action is interpolation. Interpolation differs from extrapolation in that it deals with values BETWEEN known values, whereas extrapolation is involved with EXTENDING a trend.
In many situations it is reasonable to assume that change happened uniformly over the interval--that it is linear. This is like assuming you drive at a constant speed when traveling--it may be true as a first approximation, but isn't always true.
So, linear interpolation is the process of filling in unknown values between known ones by assuming constant change. If we make a graph of this, it looks like this:
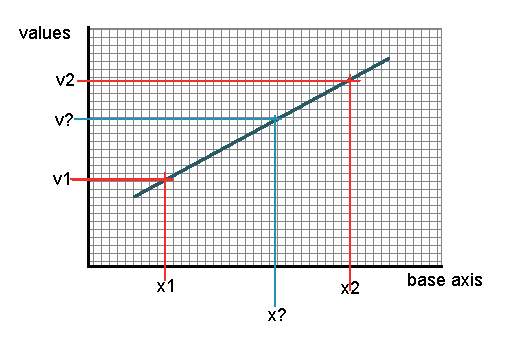
If we know the two y-axis values "v1" and "v2", measured at x-axis values x1 and x2, we can get the in-between point by applying this proportion
That is, if we're 60% of the way from x1 to x2, we should be 60% of the way from v1 to v2, and so on.
straight-lines stay straight
For both of the projections you are likely to meet (parallel and perspective), it is true that straight lines in the model (the edges of polygons) remain straight lines in the image. That is, if we know something about the two end points of a line segment, we can use linear interpolation to calculate the value between those end-points. This is helpful in a number of algorithms.
Last updated: April, 2014
