| Home |
| About Us |
| Methods |
| Sample Sites
|
| Data Repository |
| Acknowledgements |
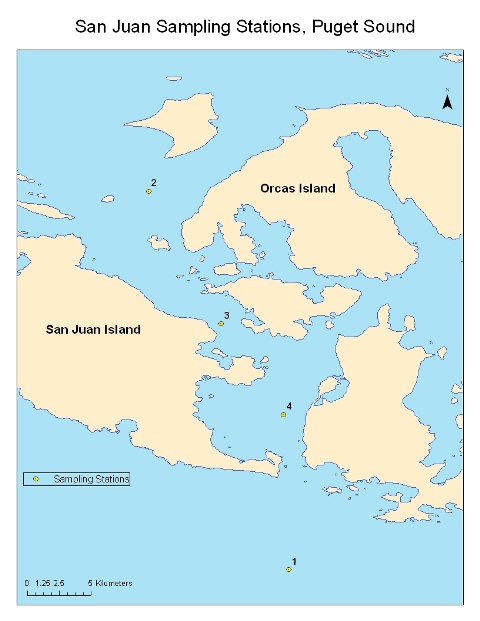
San Juan Island |
Results/Discussion: The San Juan Island archipelago has been previously sampled by research students from the University of Washington. The results from Spring 2009 was compared to the previous data recorded by former research students. This collection of data provides a historical background for subsequent UW research students that will be sampling this area in the future. The master log, CTD data, and nutrient data from the San Juan Island archipelago can be accessed by linking to the data repository located at the main option bar. This section discusses results from the CTD profile, Niskin bottle sample analysis, secchi depth, plankton and grain size analysis. All graphs are oriented as seen in the map.
San Juan Island Map (Click to Enlarge) Comparation of Methods
Click to enlarge The data for the dissolved oxygen and the flourescence concentrations were analyzed in two different ways. The first analaysis was done by the CTD and the second was done using lab procedures. When using the results of the different methods plotted against each other, the quality of the data can be observed by analyzing the best fit line of the data. The equations for the best fit lines of the data are recorded on the plots. to the rith is the correlation curve found for the Dissolved Oxygen and the one at the left is the correlation curve found for the Fluorescence data. The R2 value represents the precision of the data compared to the best fit line.
Temperature
Click to enlarge Surfer plot showing the temperatures found in all four stations. The plot shows in the (Y) axis the depth in meters and in the (X) axis the temperature in Degrees Celcious. The water temperature was found to be higher at the surface of the North San Juan Channel (Station 2). The Strait of Juan de Fuca showed stratification making the surface of the site colder than in the mid section. As the team moved north, up the San Juan Channel, no significant change in temperature was noticed. The station at the San Juan Channel displyed the most variability in temperature due to stratification o due to strong currents. Salinity
Click to enlarge Surfer plot showing the salinity levels found in all four stations. The plot shows in the (Y) axis the depth in meters and in the (X) axis the concentration of salt in SPU. Out of the four stations sampled, the station with the highest concentration of salinity was the Friday Harbor station (station 3). Which displayed a high level of stratification. Salinity was greatest at depths near the sea floor and lower near the surface. As the team moved to a different location, the overall salinity and presence of the halocline decreased and became stable. Currents traveling through the channel work to mix the salty ocean water entering through the southern opening of the channel with the less salty water entering from the northern entrance. Density
Click to enlarge Surfer plot showing the density levels found in all four stations. The plot shows in the (Y) axis the depth in meters and in the (X) axis the Density concentration in milligrams per liter. The Density data showed similar characteristics as seen in the salinity graph. Density was greatest at depths between -90m and -120m in the North San Juan Channel (Station 2) and decreased while approaching the surface in all stations. As the sampling locations moved north, the density and stratification decreased significantly. Dissolved Oxygen
Click to enlarge Surfer plot showing the Dissolved Oxygen found in all four stations. The plot shows in the (Y) axis the depth in meters and in the (X) axis the dissolved oxygen in miligrams per liter. The dissolved oxygen levels were found to be greatest at the surface in the Strait of Juan de Fuca, lowering the levels as the sampling moved north. The Strait of Juan de Fuca showed a great level of stratification, while the San Juan Channel displayed a higher level of water mixing due to the high current present during sampling. Florescence
Click to enlarge Surfer plot showing the Flourescence level found in all four stations. The plot shows in the (y) axis the depth in meters and in the (X) axis the Fluorescence in milliliters per liter. The Florescence levels found in the Strait of Juan de Fuca (station 1) are significantly higher than those found in the other three stations. This could have been caused by the water conditions during the sampling day, where the current was strong and stratification was noticible. As the sampling team moved to the north San Juan Channel, the florescence levels decreased significantly at all depths rising to normal levels as the team sampled station 3 and 4. Secchi Measurements Click to enlarge The table above, shows the secchi disk data which is used to measure water transparency in oceans. This measure is known as the secchi depth and relates to water turbidity. This table shows that station 2 had the highest turbidity at 4.5 meters. Phytoplankton
Click to enlarge This table shows the genus of phytoplankton and the count found at each station. Station 3 had the most diverse population of phytoplankton. Phytoplankton was collected from the surface and in station 1 and station 2 samples were collect from the thermocline. Sediments (Grain Size)
Click to enlarge An analysis of grain size was done of station one showing the fine grain sediments that settled in the strait of Juan de Fuca. Over 50% of the sample contained a grain size that was greater than 250 micrometers. Grain analysis was done at station two showing similarities in the sediment size, which consisted of a fine grain of measurement of 250 micrometers. Station three was also analyzed but due to the high amount of calcium carbonate shells that the sediment contained, the grain size could not be determined. An analysis of station four showed that the sediments were too large to be analyzed, and therefore the grain size could not be determined. Total Organic Carbon Click to enlarge The orgranic carbon found in station 1 through 3 shows the amount of organic matter found in the sediment samples collected during the San Juan sampling day. Station 1 had a percentage of 4.532, station 2 had a lower percentage of 3.346, and station three had the greatest percentage of 5.623. Based on the perentage result from station three, it can be concluded that the location had a greater amount of orgranic matter in the sediment. A sample was collected at station four, but due to the size of the grain, analysis could not be completed.
|


Preparing to deploy the zooplankton net
Collecting a sample bruoght up from a zooplankton net
|


